Evolution of the Macrophage CD163 Phenotype and Cytokine Profiles in a Human Model of Resolving Inflammation - PubMed (original) (raw)
Evolution of the Macrophage CD163 Phenotype and Cytokine Profiles in a Human Model of Resolving Inflammation
Betsy J Evans et al. Int J Inflam. 2013.
Abstract
Cantharidin skin blisters were examined over two days to model the acute and resolving phases of inflammation in human skin. Four blisters were created by topical administration of cantharidin (0.1% v/v) to the forearm of healthy volunteers, with IRB approval. Duplicate skin blisters were aspirated at 16 and 40 hours to model the proinflammatory and resolving phases, respectively. There was a significant increase in leukocyte infiltrate at 40 h with appearance of a "resolving macrophage" phenotype CD14(+)CD163(+) by flow cytometry. Neutrophils acquired apoptotic markers at 40 h and were observed to be phagocytosed by macrophagic "Reiter's" cells. Multiplex cytokine analysis demonstrated that monocyte chemoattractant protein (MCP-1/CCL2), interleukin- (IL-) 6, IL-8/CXCL8, macrophage inflammatory protein (MIP1 α /CCL3), MIP-1 β /CCL4, tumor necrosis factor- (TNF-) α , and eotaxin (CCL11) were all significantly upregulated at 16 h compared with 40 h. In contrast, immunoregulatory transforming growth factor- (TGF-) β , macrophage-derived chemokine (MDC/CCL22), and interferon-inducible protein (IP-10/CXCL10) were significantly elevated at 40 h. Our results demonstrate that the phases of inflammation and resolution can be discriminated in a two-day model of dermal wound healing. This confirms and extends our understanding of wound repair in humans and provides a powerful research tool for use in clinical settings and to track the molecular benefits of therapeutic intervention.
Figures
Figure 1
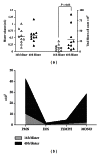
Leukocyte infiltration into cantharidin-induced skin blisters. Quadruplicate skin blisters were established by topical application of cantharidin (0.1%) to the forearm of 10 healthy individuals. Blister fluid was collected from duplicate blisters at 16 h and 40 h, respectively, and analyzed as follows (a) Fluid volume (mL) and cellularity (×105). Each point represent the average from 2 skin blisters; horizontal lines represents the population mean. (b) Differential leukocyte subpopulations. PMN: polymorphonuclear phagocytes; EOS: eosinophils; LYMPH: lymphocytes; MONO: monocytes/macrophages.
Figure 2
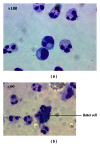
Photomicrographs of blister fluid at (a) 16 hours and (b) 40 hours. Granulocytes reveal morphological changes characteristic of apoptosis at 40 hours, including vacuolation of cytoplasm, size shrinkage, and engulfment by phagocytic “Reiter's” cells (arrow). Magnification = 100x.
Figure 3
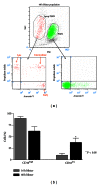
Flow cytometric analysis of PMNs in blister fluid. (a) Forward and side-scatter analyses reveal a subpopulation of smaller, less granular PMN. Gating on this subpopulation demonstrates expression of apoptosis markers, Annexin V, and Propidium Iodide (PI). Annexin V+ cells are considered at an early stage of apoptosis, Annexin V+/PI+ cells are at an intermediate stage, and Annexin V−/PI+ cells at a late stage of apoptosis. No expression of apoptosis markers is seen in the viable cell gate. (b) PMNs at 40 hours demonstrate an increased proportion of cells exhibiting a CD16low phenotype, also characteristic of apoptotic cells.
Figure 4
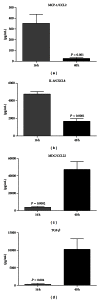
Enzyme-linked immunosorbent assay (ELISA) detection of inflammatory regulators in blister fluid: (a) MCP-1/CCL2, (b) IL-8/CXCL8, (c) MDC/CCL22, and (d) TGF_β_. Blister fluid from n = 10 individuals was analyzed by ELISA in duplicate, at each of the timepoints. Results are expressed as mean ± S.E.M. P values represent statistical differences between 16-hour and 40-hour timepoints analyzed by unpaired t test.
Figure 5
Multiplex bead array (Luminex) analysis of inflammatory regulators in blister fluid: (a) MCP-1/CCL2, (b) IL-8/CXCL8, (c) IL-6, (d) TNF_α_, (e) MIP-1_α_/CCL3, (f) MIP-1_β_/CCL4, (g) Eotaxin/CCL11, and (h) IP-10/CXCL10. Blister fluid from n = 10 individuals was analyzed by multiplex bead array at each of the timepoints. Results are expressed as mean ± S.D. P values represent statistical differences between 16-hour and 40-hour timepoints analyzed by unpaired t test.
Similar articles
- Disruption of CCR5 signaling to treat COVID-19-associated cytokine storm: Case series of four critically ill patients treated with leronlimab.
Agresti N, Lalezari JP, Amodeo PP, Mody K, Mosher SF, Seethamraju H, Kelly SA, Pourhassan NZ, Sudduth CD, Bovinet C, ElSharkawi AE, Patterson BK, Stephen R, Sacha JB, Wu HL, Gross SA, Dhody K. Agresti N, et al. J Transl Autoimmun. 2021;4:100083. doi: 10.1016/j.jtauto.2021.100083. Epub 2021 Jan 6. J Transl Autoimmun. 2021. PMID: 33521616 Free PMC article. Review. - Regulation of beta-chemokine mRNA expression in adult rat astrocytes by lipopolysaccharide, proinflammatory and immunoregulatory cytokines.
Guo H, Jin YX, Ishikawa M, Huang YM, van der Meide PH, Link H, Xiao BG. Guo H, et al. Scand J Immunol. 1998 Nov;48(5):502-8. doi: 10.1046/j.1365-3083.1998.00422.x. Scand J Immunol. 1998. PMID: 9822259 - Macrophage release of transforming growth factor beta1 during resolution of monosodium urate monohydrate crystal-induced inflammation.
Yagnik DR, Evans BJ, Florey O, Mason JC, Landis RC, Haskard DO. Yagnik DR, et al. Arthritis Rheum. 2004 Jul;50(7):2273-80. doi: 10.1002/art.20317. Arthritis Rheum. 2004. PMID: 15248227 - Eotaxin/CCL11 suppresses IL-8/CXCL8 secretion from human dermal microvascular endothelial cells.
Cheng SS, Lukacs NW, Kunkel SL. Cheng SS, et al. J Immunol. 2002 Mar 15;168(6):2887-94. doi: 10.4049/jimmunol.168.6.2887. J Immunol. 2002. PMID: 11884459 - Chemokines in the ischemic myocardium: from inflammation to fibrosis.
Frangogiannis NG. Frangogiannis NG. Inflamm Res. 2004 Nov;53(11):585-95. doi: 10.1007/s00011-004-1298-5. Inflamm Res. 2004. PMID: 15693606 Review.
Cited by
- CD163+ M2c-like macrophages predominate in renal biopsies from patients with lupus nephritis.
Olmes G, Büttner-Herold M, Ferrazzi F, Distel L, Amann K, Daniel C. Olmes G, et al. Arthritis Res Ther. 2016 Apr 18;18:90. doi: 10.1186/s13075-016-0989-y. Arthritis Res Ther. 2016. PMID: 27091114 Free PMC article. - Gene expression of catabolic inflammatory cytokines peak before anabolic inflammatory cytokines after ACL injury in a preclinical model.
Haslauer CM, Proffen BL, Johnson VM, Hill A, Murray MM. Haslauer CM, et al. J Inflamm (Lond). 2014 Nov 1;11(1):34. doi: 10.1186/s12950-014-0034-3. eCollection 2014. J Inflamm (Lond). 2014. PMID: 25400511 Free PMC article. - Macrophage-specific nanotechnology-driven CD163 overexpression in human macrophages results in an M2 phenotype under inflammatory conditions.
Alvarado-Vazquez PA, Bernal L, Paige CA, Grosick RL, Moracho Vilrriales C, Ferreira DW, Ulecia-Morón C, Romero-Sandoval EA. Alvarado-Vazquez PA, et al. Immunobiology. 2017 Aug;222(8-9):900-912. doi: 10.1016/j.imbio.2017.05.011. Epub 2017 May 16. Immunobiology. 2017. PMID: 28545809 Free PMC article. - Accumulation and localization of macrophage phenotypes with human intervertebral disc degeneration.
Nakazawa KR, Walter BA, Laudier DM, Krishnamoorthy D, Mosley GE, Spiller KL, Iatridis JC. Nakazawa KR, et al. Spine J. 2018 Feb;18(2):343-356. doi: 10.1016/j.spinee.2017.09.018. Epub 2017 Oct 12. Spine J. 2018. PMID: 29031872 Free PMC article. - Macrophages of the Cardiorenal Axis and Myocardial Infarction.
Kercheva M, Ryabov V, Gombozhapova A, Stepanov I, Kzhyshkowska J. Kercheva M, et al. Biomedicines. 2023 Jun 27;11(7):1843. doi: 10.3390/biomedicines11071843. Biomedicines. 2023. PMID: 37509483 Free PMC article.
References
- Gillitzer R, Goebeler M. Chemokines in cutaneous wound healing. Journal of Leukocyte Biology. 2001;69(4):513–521. - PubMed
- Barrientos S, Stojadinovic O, Golinko MS, Brem H, Tomic-Canic M. Growth factors and cytokines in wound healing. Wound Repair and Regeneration. 2008;16(5):585–601. - PubMed
- Stout RD. Editorial: macrophage functional phenotypes: no alternatives in dermal wound healing? Journal of Leukocyte Biology. 2010;87(1):19–21. - PubMed
LinkOut - more resources
Full Text Sources
Other Literature Sources
Research Materials
Miscellaneous


