Proteomic and genomic approaches reveal critical functions of H3K9 methylation and heterochromatin protein-1γ in reprogramming to pluripotency - PubMed (original) (raw)
Comparative Study
doi: 10.1038/ncb2768. Epub 2013 Jun 9.
Michelle Gonzales-Cope, Constantinos Chronis, Giancarlo Bonora, Robin McKee, Chengyang Huang, Sanjeet Patel, David Lopez, Nilamadhab Mishra, Matteo Pellegrini, Michael Carey, Benjamin A Garcia, Kathrin Plath
Affiliations
- PMID: 23748610
- PMCID: PMC3733997
- DOI: 10.1038/ncb2768
Comparative Study
Proteomic and genomic approaches reveal critical functions of H3K9 methylation and heterochromatin protein-1γ in reprogramming to pluripotency
Rupa Sridharan et al. Nat Cell Biol. 2013 Jul.
Abstract
Reprogramming of somatic cells into induced pluripotent stem cells (iPSCs) involves a marked reorganization of chromatin. To identify post-translational histone modifications that change in global abundance during this process, we have applied a quantitative mass-spectrometry-based approach. We found that iPSCs, compared with both the starting fibroblasts and a late reprogramming intermediate (pre-iPSCs), are enriched for histone modifications associated with active chromatin, and depleted for marks of transcriptional elongation and a subset of repressive modifications including H3K9me2/me3. Dissecting the contribution of H3K9 methylation to reprogramming, we show that the H3K9 methyltransferases Ehmt1, Ehmt2 and Setdb1 regulate global H3K9me2/me3 levels and that their depletion increases iPSC formation from both fibroblasts and pre-iPSCs. Similarly, we find that inhibition of heterochromatin protein-1γ (Cbx3), a protein known to recognize H3K9 methylation, enhances reprogramming. Genome-wide location analysis revealed that Cbx3 predominantly binds active genes in both pre-iPSCs and pluripotent cells but with a strikingly different distribution: in pre-iPSCs, but not in embryonic stem cells, Cbx3 associates with active transcriptional start sites, suggesting a developmentally regulated role for Cbx3 in transcriptional activation. Despite largely non-overlapping functions and the predominant association of Cbx3 with active transcription, the H3K9 methyltransferases and Cbx3 both inhibit reprogramming by repressing the pluripotency factor Nanog. Together, our findings demonstrate that Cbx3 and H3K9 methylation restrict late reprogramming events, and suggest that a marked change in global chromatin character constitutes an epigenetic roadblock for reprogramming.
Figures
Figure 1. Global levels of the majority of histone PTMs differ between MEFs and iPSCs
A) Graph displaying the percentage of acetylated (ac) lysine (K) residues in female iPSCs and MEFs. Data presented is the mean of 6 values obtained from 2 biological replicates, each analyzed three times. The asterisks indicate significantly different levels between iPSCs and MEFs at p<0.01 determined by the t-test. Error bar = standard deviation of six replicates. Source data are provided in Supp Table 1. B) Pie charts indicating the percentage of mono- (me1), di- (me2), and tri- (me3) methylated and unmethylated (un) forms of the indicated lysine residues in female iPSCs and MEFs. The unmethylated portion represents the sum of acetylated and unacetylated isoforms. Standard deviations for six replicates and significant differences in these PTMs between iPSCs and MEFs are provided in Fig S1B. C) Log2 ratio of the percentage of methylated and unmethylated lysines between female MEFs and iPSCs. Histone PTMs that are lower in MEFs than iPSCs are highlighted in green and those that are higher in MEFs than iPSCs in orange. The unmethylated state can be acetylated and/or unacetylated. D) Hierarchical clustering of ChIP-chip data for H3K18me1, H3K79me2, RNA polymerase II, and H3K4me3 for 18300 genes. Each row represents the promoter region of a gene spanning −5.5kb to +2.5kb relative to the TSS, divided into sixteen 500bp fragments that display the average log ratio of probe signal intensity with blue, yellow, and grey representing lower-than-average, higher-than-average, and missing values (mostly due to lack of probes in those regions) for enrichment relative to input. E) As in (A), except that the combination of PTMs on the histone H3 peptide containing amino acid 9 to 17 were quantified. Data presented is the mean of 6 values obtained from 2 biological replicates, each analyzed three times. The K9 residue exists in the ac, me1, me2, me3, or the unmethylated/unacetylated (un) forms, and K14 in the ac or un forms. Each combination of histone PTMs on K9 and K14 is referred to as peptide isoform. Source data are provided in Supp Table 1.
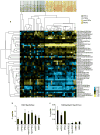
Figure 2. Comparison of histone PTM profiles between ESCs, iPSCs, pre-iPSCs, and MEFs
A) Unsupervised hierarchical clustering of the log2 ratio of the percentage of histone isoforms for each qMS replicate in the indicated cell types relative to the average percentage of the same isoform in female iPSCs. Cell types included are: female iPSCs (fiPSCs, 6 replicates), male iPSCs (miPSCs; 6 replicates), male ESCs (mESCs, 6 replicates), female pre-iPSCs (fpre-iPSCs, 5 replicates), male pre-iPSCs (mpre-iPSCs, 5 replicates), male (mMEFs, 6 replicates), and female fibroblasts (fMEFs, 6 replicates). In the heat map, yellow represents isoforms that are more abundant than in fiPSCs and blue those that are less abundant. For the H4 peptide including amino acids 4–17, 1ac refers to the sum of isoforms that have a single acetylated lysine among K5, K8, K12 or K16; 2ac and 3ac to the sum of all isoforms with 2 and 3 acetyl marks, respectively; and 4ac to the completely acetylated peptide. B) The graph displays the percentage of the isoform of the H3 peptide containing amino acids 18–26 that is acetylated at both K18 and K23, for the indicated cell types. Data presented is the mean of 6 values obtained from 2 biological replicates, each analyzed three times. Error bars indicate standard deviation. Source data are provided in Supp Table 1. C) As in (B), except for the isoform of the H4 peptide containing amino acids 4–17 with acetylation at positions K5, K8, and K12, but not K16.
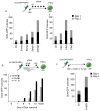
Figure 3. H3K9 methyltransferases, demethylases, and methyl binders are critical for reprogramming
A) Depletion of H3K9 HMTases and Cbx3 enhances OSK reprogramming. _Oct4_-GFP reporter MEFs were infected with individual retroviruses expressing Oct4, Sox2, and Klf4 (OSK) and transfected with siRNAs targeting the indicated genes every three days starting on day seven post-infection. The number of GFP-positive colonies was determined on day 25 of reprogramming: i) for the knockdown of H3K9 methyltransferases Ehmt1, Ehmt2, and Setdb1; either singly or combined (indicated as 3XHMT); ii) for the knockdown of the heterochromatin protein 1 family members Cbx1 = HP1β, Cbx3 = HP1γ, or Cbx5 = HP1α. Data from two technical replicates (Rep1 and Rep2) from one out of three representative experiments are presented,. B) Depletion of the H3K9 HMTases or Cbx3 enhances the efficiency and kinetics of OSCK reprogramming. _Oct4_-GFP reporter MEFs carrying a single, doxycycline (dox)- inducible polycistronic transgene encoding Oct4, Sox2, cMyc, and Klf4 (OSCK) were induced to reprogram by the addition of dox. On days 4, 6 and 10 post-induction, control siRNAs or the siRNA cocktail targeting 3XHMT or Cbx3 were transfected. To determine when reprogramming factor-independent GFP-positive colonies can be obtained, dox was withdrawn on days 6, 7, 8, 9, and 10, respectively, and in all cases the number of GFP-positive colonies determined on day 15. Upon dox withdrawal, siRNA treatments were not continued. C) Overexpression of the histone H3K9 demethylase Jmjd2c enhances reprogramming. _Oct4_-GFP reporter MEFs were reprogrammed with OSK as in (A) with the addition of Tomato (control) or _Jmjd2c-_expressing retroviruses. The number of GFP-positive colonies obtained was quantified on day 25. Data from two technical replicates (Rep1 and Rep 2) from one out of three representative experiments are presented.
Figure 4. Interference with H3K9 methyltransferases or Cbx3 induces reprogramming in pre-iPSCs
A) pre-iPSCs derived from _Nanog_-GFP reporter MEFs by retroviral expression of Oct4, Sox2, Klf4, and cMyc were transfected once with the indicated siRNAs. Reprogramming efficiency was determined by FACS analysis of GFP-positive cells on day 14 post siRNA transfection (i) or by counting the number of GFP-positive colonies on day 15 (ii). Note: colony numbers presented for Cbx3 and 3XHMT single knockdowns are the same as in Fig 6Diii, tetO-Nanog(−)/dox(−) condition). Repeated transfection of the siRNAs did not result in an increase in the number of GFP-positive cells. B) _Nanog_-GFP-positive ESC-like colonies obtained upon Cbx3 knockdown in pre-iPSCs were expanded and two lines (iPSCs-Cbx3 #1 and #2) analyzed by qRT-PCR for transcript levels of the pluripotency genes Esrrb and Nanog. For comparison, ESCs, MEFs, and the starting pre-iPSCs, which were set to 1, are included in the analysis. Data presented is the mean of three technical replicates from one experiment.
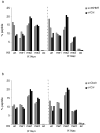
Figure 5. Depletion of the H3K9 HMTases but not of Cbx3 induces a change in PTMs on the histone H3 K9/K14 peptide in pre-iPSCs
A) Percentages of the different isoforms of the H3 peptide containing the amino acids 9 to 17 (in which K9 and K14 are modified) in pre-iPSCs, three days post-transfection of control and 3XHMT siRNAs, determined by qMS. The data for two biological replicates are given. Source data are provided in Supp Table 2. B) As in (A), except that the qMS approach was performed upon Cbx3 knockdown.
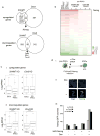
Figure 6. Depletion of H3K9 HMTases and Cbx3 promotes reprogramming of pre-iPSCs by inducing Nanog expression
A) pre-iPSCs were transfected with control siRNAs or siRNAs targeting the three H3K9 HMTases (3XHMT) or Cbx3, and genome-wide expression was determined three days post-transfection. The venn diagrams show the overlap of genes that are up- or down- regulated in pre-iPSCs 3XHMT and Cbx3 knockdown, respectively, compared to control transfected cells. The asterisks denote significant overlap determined by the hypergeometric test, with a p-value of 5.19 × 10⁻³¹ and 5.84 × 10−39 for up- and downregulated genes, respectively. Interesting differentially expressed genes are indicated. Source data are provided in Supp Table 3. B) Expression changes in pre-iPSCs upon 3XHMTase or Cbx3 knockdowns in relation to expression in pluripotent cells. The heatmap shows the differential expression (log2) for all genes (16333) between ESCs, iPSCs, two replicates of the 3XHMT knockdown in pre-iPSCs, and three replicates of Cbx3 knockdown in pre-iPSCs, each relative to control siRNA-transfected pre-iPSCs. Genes are ranked based on average expression differences caused by the 3XHMTase knockdown. Among the most upregulated genes is Nanog. Source data are provided in Supp Table 3. C) (i) Box plot of the absolute gene expression levels in ESCs and pre-iPSCs for genes 1.5 fold up regulated upon 3XHMT knockdown (left) and Cbx3 knockdown (right) in pre-iPSCs; (ii) for genes 1.5-fold downregulated. Significance of difference in expression was determined by the Wilcoxon test, *p< 0.05, ***p<0.01. Source data are provided in Supp Table 3. D) Combination of Nanog overexpression and 3XHMT or Cbx3 knockdowns in pre-iPSCs. (i) pre-iPSCs derived from _Nanog_-GFP reporter MEFs that carried the M2rtta (reverse tetracycline transactivator) were infected with a doxycycline (Dox)-inducible lentivirus encoding the Nanog cDNA and transfected once with siRNAs as indicated. (ii) Immunostaining for Nanog protein (green) of lentivirally infected cells in the presence or absence of dox. Dapi (blue) marks nuclei. (iii) Quantification of the number of GFP-positive colonies on day 15 post siRNA treatments for pre-iPSCs with and without the Nanog virus (tetO-Nanog), in the presence or absence of dox.
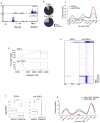
Figure 7. Cell type-specific occupancy of Cbx3 at TSS
A) Snapshot of Cbx3 ChIP-seq data at the Nanog locus in pre-iPSCs and ESCs. Note that the neighboring gene Slc2a3 displays Cbx3 binding in the coding region in ESCs but not in pre-iPSCs. B) Distribution of significant Cbx3 peaks between genic regions and non-genic regions, in both pre-iPSCs and ESCs, based on ChIP-seq. A Cbx3 peak was assigned to genic regions when it overlapped with a region from the TSS (transcriptional start site) to the 3′ end of the gene. C) Frequency of sites bound significantly by Cbx3 with respect to the TSS is depicted for both pre-iPSCs and ESCs. D) Average gene profiles for Cbx3 enrichment in pre-iPSCs and ESCs. Y-axis represents average signal (tag count) from 100bp windows. E) Heatmap of Cbx3 enrichment for all genes from 5kb upstream to 5kb downstream of the TSS in pre-iPSCs and ESCs, divided into five groups based on K-means clustering. Blue denotes enrichment in a 100bp bin normalized to 1 million reads subtracted from normalized input values; values were log2 transformed. F) Cbx3 occupied genes are more highly expressed than unbound genes. Box plot of absolute gene expression levels in ESCs and pre-iPSCs for Cbx3-bound and unbound genes. Log2 expression levels are based on reads per kilobase per million mapped reads (RPKM) from RNA-seq data for these cell types. In this figure, genes were considered bound when Cbx3 was enriched anywhere in a region encompassing 10kb upstream of the TSS and the coding region. ***p<0.01, Wilcoxon test. G) Distribution of Cbx3 binding sites with respect to distance to the TSS for genes that are up- and downregulated, respectively, in pre-iPSCs upon Cbx3 knockdown. All source for this figure data are provided in Supp Table 4.
Figure 8. Cbx3 association with mediator components
A) Cbx3 co-localizes with Mediator at the TSS. Heatmap of Cbx3 and Mediator (Med1 subunit) enrichment in pre-iPSCs for all genes from 5kb upstream to 5kb downstream of the TSS, divided into five groups based on K-means co-clustering, based on ChIP-seq. Blue denotes enrichment in a 100bp bin normalized to 1 million reads subtracted from normalized input values; values were log2 transformed. B) Cbx3 precipitates more efficiently with Med29 in differentiated cells than ESCs. Immunoprecipitates (IP) of Flag-Med29 from ESCs and differentiated cells (neural precursors differentiated from ESCs) were probed with antibodies to Cbx3 or Med6 by western blotting (WB). 1% of input and 5% of IP are shown. Equal amounts of Cbx3 and Med6 are present in inputs from both cell types.. Cbx3 but not the control Med26 is enriched in the Med29 IP in NPCs. C) Cbx3 is recruited to the PIC in an activator-dependent manner. Transcriptional preinitiation complexes (PICs) were formed in the presence and absence of a model activator GAL4-VP16 in nuclear extract. Note that Cbx3 was only incorporated in the PIC when the VP16 transcriptional activator was present, similar to Mediator (subunits Med1, Med6, Cdk8) and the Mll complex component Rbbp5. Uncropped scans are available in Figure Supp Fig 5.
Similar articles
- Coordinated removal of repressive epigenetic modifications during induced reversal of cell identity.
Tran KA, Dillingham CM, Sridharan R. Tran KA, et al. EMBO J. 2019 Nov 15;38(22):e101681. doi: 10.15252/embj.2019101681. Epub 2019 Oct 4. EMBO J. 2019. PMID: 31583744 Free PMC article. - Chromatin-modifying enzymes as modulators of reprogramming.
Onder TT, Kara N, Cherry A, Sinha AU, Zhu N, Bernt KM, Cahan P, Marcarci BO, Unternaehrer J, Gupta PB, Lander ES, Armstrong SA, Daley GQ. Onder TT, et al. Nature. 2012 Mar 4;483(7391):598-602. doi: 10.1038/nature10953. Nature. 2012. PMID: 22388813 Free PMC article. - Global epigenetic changes during somatic cell reprogramming to iPS cells.
Mattout A, Biran A, Meshorer E. Mattout A, et al. J Mol Cell Biol. 2011 Dec;3(6):341-50. doi: 10.1093/jmcb/mjr028. Epub 2011 Nov 1. J Mol Cell Biol. 2011. PMID: 22044880 - Cellular trajectories and molecular mechanisms of iPSC reprogramming.
Apostolou E, Stadtfeld M. Apostolou E, et al. Curr Opin Genet Dev. 2018 Oct;52:77-85. doi: 10.1016/j.gde.2018.06.002. Epub 2018 Jun 17. Curr Opin Genet Dev. 2018. PMID: 29925040 Free PMC article. Review. - Transcriptional and epigenetic mechanisms of cellular reprogramming to induced pluripotency.
van den Hurk M, Kenis G, Bardy C, van den Hove DL, Gage FH, Steinbusch HW, Rutten BP. van den Hurk M, et al. Epigenomics. 2016 Aug;8(8):1131-49. doi: 10.2217/epi-2016-0032. Epub 2016 Jul 15. Epigenomics. 2016. PMID: 27419933 Free PMC article. Review.
Cited by
- DOT1L is a barrier to histone acetylation during reprogramming to pluripotency.
Wille CK, Zhang X, Haws SA, Denu JM, Sridharan R. Wille CK, et al. Sci Adv. 2023 Nov 15;9(46):eadf3980. doi: 10.1126/sciadv.adf3980. Epub 2023 Nov 17. Sci Adv. 2023. PMID: 37976354 Free PMC article. - Manipulating cell fate through reprogramming: approaches and applications.
Yagi M, Horng JE, Hochedlinger K. Yagi M, et al. Development. 2024 Oct 1;151(19):dev203090. doi: 10.1242/dev.203090. Epub 2024 Sep 30. Development. 2024. PMID: 39348466 Review. - Transcription factors specifically control change.
Rothenberg EV. Rothenberg EV. Genes Dev. 2022 Nov-Dec 1;36(21-24):1097-1099. doi: 10.1101/gad.350308.122. Genes Dev. 2022. PMID: 36622807 Free PMC article. Review. - Coordinated removal of repressive epigenetic modifications during induced reversal of cell identity.
Tran KA, Dillingham CM, Sridharan R. Tran KA, et al. EMBO J. 2019 Nov 15;38(22):e101681. doi: 10.15252/embj.2019101681. Epub 2019 Oct 4. EMBO J. 2019. PMID: 31583744 Free PMC article. - The occurrence and development of induced pluripotent stem cells.
Chen Y, Li M, Wu Y. Chen Y, et al. Front Genet. 2024 Apr 18;15:1389558. doi: 10.3389/fgene.2024.1389558. eCollection 2024. Front Genet. 2024. PMID: 38699229 Free PMC article. Review.
References
- Takahashi K, Yamanaka S. Induction of Pluripotent Stem Cells from Mouse Embryonic and Adult Fibroblast Cultures by Defined Factors. Cell. 2006;126:663–676. - PubMed
Publication types
MeSH terms
Substances
Grants and funding
- DP2OD001686/OD/NIH HHS/United States
- R01 GM074701/GM/NIGMS NIH HHS/United States
- T32 HG002536/HG/NHGRI NIH HHS/United States
- R25 GM055052/GM/NIGMS NIH HHS/United States
- DP2 OD007447/OD/NIH HHS/United States
- P01 GM081621/GM/NIGMS NIH HHS/United States
- DP2 OD001686/OD/NIH HHS/United States
- DP2OD007447/OD/NIH HHS/United States
- P01 GM099134/GM/NIGMS NIH HHS/United States
- GM074701/GM/NIGMS NIH HHS/United States
LinkOut - more resources
Full Text Sources
Other Literature Sources
Molecular Biology Databases
Research Materials
Miscellaneous

