Persistent infection with Crohn's disease-associated adherent-invasive Escherichia coli leads to chronic inflammation and intestinal fibrosis - PubMed (original) (raw)
Persistent infection with Crohn's disease-associated adherent-invasive Escherichia coli leads to chronic inflammation and intestinal fibrosis
Cherrie-Lee N Small et al. Nat Commun. 2013.
Abstract
Crohn's disease is a chronic inflammatory condition of the gastrointestinal tract in which alterations to the bacterial community contribute to disease. Adherent-invasive Escherichia coli are associated with human Crohn's disease; however, their role in intestinal immunopathology is unclear because of the lack of an animal model compatible with chronic timescales. Here we establish chronic adherent-invasive Escherichia coli infection in streptomycin-treated conventional mice (CD1, DBA/2, C3H, 129e and C57BL/6), enabling the study of host response and immunopathology. Adherent-invasive Escherichia coli induces an active T-helper 17 response, heightened levels of proinflammatory cytokines and fibrotic growth factors, with transmural inflammation and fibrosis. Depletion of CD8+ T cells increases caecal bacterial load, pathology and intestinal fibrosis in C57BL/6 mice, suggesting a protective role. Our findings provide evidence that chronic adherent-invasive Escherichia coli infections result in immunopathology similar to that seen in Crohn's disease. With this model, research into the host and bacterial genetics associated with adherent-invasive Escherichia coli-induced disease becomes more widely accessible.
Conflict of interest statement
Competing Financial Interests
The authors declare no competing financial interests.
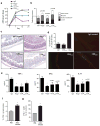
Figures
Figure 1. Competitive infection between AIEC strain LF82 and NRG857c and NRG857c localization in the cecum of CD1 mice
a. Mice were infected with an equal mixture of AIEC strains LF82 and NRG857c and individual AIEC populations were enumerated in fecal output. Each data point represents the competitive index (CI) from an individual animal. Solid lines indicate the geometric mean for each group (n=5). b. Quantification of AIEC in feces of monocolonized mice. * P<0.05; **P<0.01 (Mann-Whitney). Data are means with standard error from 4–9 mice per group from two experiments. c. Immunohistochemistry of cecal sections 28 days after infection with NRG857c and in PBS controls. Tissue was fixed and processed for immunohistochemical staining using an antibody directed against the O83 antigen found on AIEC strain NRG857c (brown stain in images). Images are representative from two separate experiments.
Figure 2. Bacterial load of AIEC in various mouse strains
Groups of conventional mice; a. CD1, b. DBA/2, c. 129e, d. C3H and e. C57BL/6 were infected with AIEC NRG857c and organs were harvested following infection. Data are expressed as the means with standard error of four mice per time point and representing two independent experiments. *P <0.05, ** P <0.001 (one-way ANOVA with Tukey post-test) for comparisons between the time points indicated by bars.
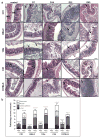
Figure 3. Inflammation and tissue pathology in the cecum following chronic infection with AIEC
a. H&E staining of cecal sections from CD1, DBA/2, 129e, C3H and C57BL/6 mice after AIEC infection and from uninfected controls. Images are representative of two experiments with four mice per time point. MM, muscularis mucosa; SM, submucosa; M, mucosa; L, lumen. Arrows indicate submucosa edema, desquamation, hyperplasia, inflammatory cellular infiltrates and epithelial sloughing. b. Cecal pathology was scored 3 weeks after infection. Scores represent an average of 5 views per section and data are expressed as the means with SD for each group. Original magnification: 200x; scale bar: 200 μm.
Figure 4. Th1 and Th17 inflammatory responses in the colon and cecum following chronic AIEC infection
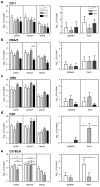
The colon and cecum from groups of mice were removed and processed. a. TNF-α, b. IFN-γ, c. IL-17 and d. MCP1 were measured from the colon (left panels) and cecum (right panels) by ELISA. Data are the mean with standard error from four mice per group and from two independent experiments. *P <.05, **P <.01, *** P <.001 (compared to uninfected controls; one-way ANOVA with Dunnett post-test).
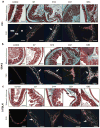
Figure 5. Intestinal fibrosis in the cecum following chronic AIEC infection
Masson’s trichrome and PSR staining of cecal tissue from a. CD1, b. DBA/2, and c. C57BL/6 mice following AIEC infection and from uninfected controls. Black arrows in the Masson’s trichrome panels indicate collagen deposition (green) in the submucosa and the mucosa surrounding inflammatory cellular infiltrates. White arrows in the PSR panels indicate collagen fibrils (large collagen fibers, yellow/orange; thinner fibers, green) in the muscularis mucosa, submucosa and mucosa. MM, muscularis mucosa; SM, submucosa; M_,_ mucosa. Images are representative of two experiments with four mice per time point. Original magnification: 200x; scale bar: 200 μm.
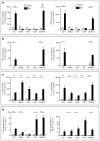
Figure 6. Profibrotic mediators associated with AIEC-induced fibrosis
The mRNA levels of a. TGF-β1, b. CTGF and c. IGF1 expression in the colon (upper panels) and cecum (lower panels) was determined three weeks post-AIEC infection. Data is normalized to 18s RNA and expressed as fold-change relative to the uninfected control. Quantification of d. collagen type I (Col1a2) and e. collagen type III (Col3a1) was determined by qRT-PCR. Data was normalized to 18s RNA and expressed as fold-change relative to the uninfected PBS-treated control. Data are expressed as the means with standard error from four mice per group representative of two independent experiments. *P <0.05, **P<0.005, *** P <0.001 compared to uninfected PBS-treated controls (one-way ANOVA with Dunnett post-test).
Figure 7. Intestinal pathology is associated with increased numbers of immune cells during chronic AIEC infection
Formalin-fixed sections from C57BL/6 mice infected with NRG857c for 21 days were IHC stained for a. F4/80, b. Foxp3 and c. CD3. Each image is representative of 3 mice per experiment and quantification represent an average of 6–8 views per section. Scale bar: 200 μm.
Figure 8. CD8+ immune cells are protective role during chronic AIEC infection
a. Rag1−/−, CD4-, CD8-depleted, and IgG control mice were infected with NRG857c (3 mice per group, experiment repeated twice). AIEC load in fecal pellets was quantified from immune-depleted mice over time. At day 21, cecal tips were scored for histopathology (b) on H&E-stained sections (c) scale bar: 50 μm. d. Cecal sections were stained with PSR for quantification of fibrosis. Original magnification, 200x. e. Cytokines were measured from cecal explant supernatants by ELISA. C57BL/6 mice were infected with NRG857c or mock infected with PBS (3 mice per group were pooled, and experiment was repeated 3 times), and at day 21 after infection the cecum was excised and lamina propria immune cells were isolated and stained for FACS analysis. f. Percentage of CD45.2+ CD8+ lymphocytes measured by flow cytometry of lamina propria cells from AIEC-infected C57BL/6 mice (day 21). g. The number of CD8+ IFNγ+ lamina propria cells measured by flow cytometry expressed as a percentage of the PBS control. Data are the means with standard error. *P<0.05 (student t-test).
Similar articles
- Understanding host-adherent-invasive Escherichia coli interaction in Crohn's disease: opening up new therapeutic strategies.
Agus A, Massier S, Darfeuille-Michaud A, Billard E, Barnich N. Agus A, et al. Biomed Res Int. 2014;2014:567929. doi: 10.1155/2014/567929. Epub 2014 Dec 15. Biomed Res Int. 2014. PMID: 25580435 Free PMC article. Review. - An Intestinal Th17 Subset is Associated with Inflammation in Crohn's Disease and Activated by Adherent-invasive Escherichia coli.
Paroni M, Leccese G, Ranzani V, Moschetti G, Chiara M, Perillo F, Ferri S, Clemente F, Noviello D, Conforti FS, Ferrero S, Karnani B, Bosotti R, Vasco C, Curti S, Crosti MC, Gruarin P, Rossetti G, Conte MP, Vecchi M, Pagani M, Landini P, Facciotti F, Abrignani S, Caprioli F, Geginat J. Paroni M, et al. J Crohns Colitis. 2023 Dec 30;17(12):1988-2001. doi: 10.1093/ecco-jcc/jjad119. J Crohns Colitis. 2023. PMID: 37462681 Free PMC article. - Lactoferrin prevents invasion and inflammatory response following E. coli strain LF82 infection in experimental model of Crohn's disease.
Bertuccini L, Costanzo M, Iosi F, Tinari A, Terruzzi F, Stronati L, Aloi M, Cucchiara S, Superti F. Bertuccini L, et al. Dig Liver Dis. 2014 Jun;46(6):496-504. doi: 10.1016/j.dld.2014.02.009. Epub 2014 Mar 13. Dig Liver Dis. 2014. PMID: 24631031 - Adherent-invasive E. coli metabolism of propanediol in Crohn's disease regulates phagocytes to drive intestinal inflammation.
Viladomiu M, Metz ML, Lima SF, Jin WB, Chou L; JRI Live Cell Bank; Guo CJ, Diehl GE, Simpson KW, Scherl EJ, Longman RS. Viladomiu M, et al. Cell Host Microbe. 2021 Apr 14;29(4):607-619.e8. doi: 10.1016/j.chom.2021.01.002. Epub 2021 Feb 3. Cell Host Microbe. 2021. PMID: 33539767 Free PMC article. - Adherent-invasive Escherichia coli and Crohn's disease.
Barnich N, Darfeuille-Michaud A. Barnich N, et al. Curr Opin Gastroenterol. 2007 Jan;23(1):16-20. doi: 10.1097/MOG.0b013e3280105a38. Curr Opin Gastroenterol. 2007. PMID: 17133079 Review.
Cited by
- Agr2-associated ER stress promotes adherent-invasive E. coli dysbiosis and triggers CD103+ dendritic cell IL-23-dependent ileocolitis.
Viladomiu M, Khounlotham M, Dogan B, Lima SF, Elsaadi A, Cardakli E, Castellanos JG, Ng C, Herzog J, Schoenborn AA, Ellermann M, Liu B, Zhang S, Gulati AS, Sartor RB, Simpson KW, Lipkin SM, Longman RS. Viladomiu M, et al. Cell Rep. 2022 Nov 15;41(7):111637. doi: 10.1016/j.celrep.2022.111637. Cell Rep. 2022. PMID: 36384110 Free PMC article. - Understanding host-adherent-invasive Escherichia coli interaction in Crohn's disease: opening up new therapeutic strategies.
Agus A, Massier S, Darfeuille-Michaud A, Billard E, Barnich N. Agus A, et al. Biomed Res Int. 2014;2014:567929. doi: 10.1155/2014/567929. Epub 2014 Dec 15. Biomed Res Int. 2014. PMID: 25580435 Free PMC article. Review. - Yersiniabactin-Producing Adherent/Invasive Escherichia coli Promotes Inflammation-Associated Fibrosis in Gnotobiotic Il10-/- Mice.
Ellermann M, Gharaibeh RZ, Fulbright L, Dogan B, Moore LN, Broberg CA, Lopez LR, Rothemich AM, Herzog JW, Rogala A, Gordon IO, Rieder F, Brouwer CR, Simpson KW, Jobin C, Sartor RB, Arthur JC. Ellermann M, et al. Infect Immun. 2019 Oct 18;87(11):e00587-19. doi: 10.1128/IAI.00587-19. Print 2019 Nov. Infect Immun. 2019. PMID: 31481410 Free PMC article. - Editing of the gut microbiota reduces carcinogenesis in mouse models of colitis-associated colorectal cancer.
Zhu W, Miyata N, Winter MG, Arenales A, Hughes ER, Spiga L, Kim J, Sifuentes-Dominguez L, Starokadomskyy P, Gopal P, Byndloss MX, Santos RL, Burstein E, Winter SE. Zhu W, et al. J Exp Med. 2019 Oct 7;216(10):2378-2393. doi: 10.1084/jem.20181939. Epub 2019 Jul 29. J Exp Med. 2019. PMID: 31358565 Free PMC article. - Evidence for a Causal Role for Escherichia coli Strains Identified as Adherent-Invasive (AIEC) in Intestinal Inflammation.
Kittana H, Gomes-Neto JC, Heck K, Juritsch AF, Sughroue J, Xian Y, Mantz S, Segura Muñoz RR, Cody LA, Schmaltz RJ, Anderson CL, Moxley RA, Hostetter JM, Fernando SC, Clarke J, Kachman SD, Cressler CE, Benson AK, Walter J, Ramer-Tait AE. Kittana H, et al. mSphere. 2023 Apr 20;8(2):e0047822. doi: 10.1128/msphere.00478-22. Epub 2023 Mar 8. mSphere. 2023. PMID: 36883813 Free PMC article.
References
- Henderson P, van Limbergen JE, Wilson DC, Satsangi J, Russell RK. Genetics of childhood-onset inflammatory bowel disease. Inflamm Bowel Dis. 2011;17:346–361. - PubMed
- Molodecky NA, et al. Increasing incidence and prevalence of the inflammatory bowel diseases with time, based on systematic review. Gastroenterology. 2012;142:46–54. - PubMed
- Benchimol EI, et al. Epidemiology of pediatric inflammatory bowel disease: a systematic review of international trends. Inflamm Bowel Dis. 2011;17:423–439. - PubMed
- Ruemmele FM. Pediatric inflammatory bowel diseases: coming of age. Curr Opin Gastroenterol. 2010;26:332–336. - PubMed
- Van Limbergen J, Wilson DC, Satsangi J. The genetics of Crohn’s disease. Ann Rev Genomics Hum Genetics. 2009;10:89–116. - PubMed
Publication types
MeSH terms
Substances
LinkOut - more resources
Full Text Sources
Other Literature Sources
Medical
Research Materials

