Simultaneous application of heat, drought, and virus to Arabidopsis plants reveals significant shifts in signaling networks - PubMed (original) (raw)
Simultaneous application of heat, drought, and virus to Arabidopsis plants reveals significant shifts in signaling networks
Christian Maximilian Prasch et al. Plant Physiol. 2013 Aug.
Abstract
Considering global climate change, the incidence of combined drought and heat stress is likely to increase in the future and will considerably influence plant-pathogen interactions. Until now, little has been known about plants exposed to simultaneously occurring abiotic and biotic stresses. To shed some light on molecular plant responses to multiple stress factors, a versatile multifactorial test system, allowing simultaneous application of heat, drought, and virus stress, was developed in Arabidopsis (Arabidopsis thaliana). Comparative analysis of single, double, and triple stress responses by transcriptome and metabolome analysis revealed that gene expression under multifactorial stress is not predictable from single stress treatments. Hierarchical cluster and principal component analyses identified heat as the major stress factor, clearly separating heat-stressed from non-heat-stressed plants. We identified 11 genes differentially regulated in all stress combinations as well as 23 genes specifically regulated under triple stress. Furthermore, we showed that virus-treated plants displayed enhanced expression of defense genes, which was abolished in plants additionally subjected to heat and drought stress. Triple stress also reduced the expression of genes involved in the R-mediated disease response and increased the cytoplasmic protein response, which was not seen under single stress conditions. These observations suggested that abiotic stress factors significantly altered turnip mosaic virus-specific signaling networks, which led to a deactivation of defense responses and a higher susceptibility of plants. Collectively, our transcriptome and metabolome data provide a powerful resource to study plant responses during multifactorial stress and allow identifying metabolic processes and functional networks involved in tripartite interactions of plants with their environment.
Figures
Figure 1.
Design of multifactorial stress experiments. The scheme illustrates the experimental design for exposing Arabidopsis plants to heat, drought, and viral stress (TuMV) separately or in the different combinations as described in “Materials and Methods.” To mimic the severity of the triple stress experiment, plants were additionally treated with severe heat in an independent experiment. Leaves of all conditions were harvested: heat, drought, TuMV, drought and heat, TuMV and heat, drought and TuMV, TuMV, drought, and heat, and severe heat. The photograph shows the phenotypes of control and heat-treated plants.
Figure 2.
Transcriptome and metabolome profiles of triple-stressed plants. A, Condition tree based on hierarchical clustering of expression data separating replicates of each condition. For the analysis, four biological replicates were hybridized. Colored boxes at the bottom indicate different treatments. B, Condition tree based on hierarchical clustering of metabolome data separating treatments of each condition. Metabolome data are given as mean values with n = 3. Conditions are as follows: heat (h), drought (d), TuMV (v), drought and heat (dh), TuMV and heat (vh), drought and TuMV (dv), and TuMV, drought, and heat (vdh).
Figure 3.
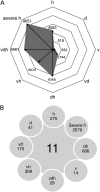
Transcriptome profiles of multifactorially stressed plants. A, Number of statistically significant features for each stress condition identified by volcano-plot analysis. The significance threshold was set at change greater than 2-fold and false discovery rate less than 0.05. B, Intersection identifying at least 2-fold statistically significant entities present in all stress conditions as well as features unique to individual treatments. Conditions are as follows: heat (h), drought (d), TuMV (v), drought and heat (dh), TuMV and heat (vh), drought and TuMV (dv), TuMV, drought, and heat (vdh), and severe heat (severe h).
Figure 4.
qPCR analysis of the viral P3 gene in TuMV-infected Arabidopsis plants. Accumulation of P3 mRNA was quantified by quantitative RT-PCR using primers published by Kim et al. (2010). Relative expression levels were normalized to tubulin expression. Error bars represent
se
(n = 3). v, Virus infection; vd, combined virus infection and drought stress; vh, combined virus infection and heat stress; vdh, combined virus infection, drought, and heat stress.
Figure 5.
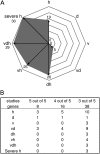
Shifts of gene expression patterns analyzing defense systems of plants exposed to single stress compared with multifactorial or severe heat stress. A, Number of differentially regulated genes according to the functional group “stress” is given for each treatment. B, Distribution of stress-regulated features annotated as TIR-NBS-LRR genes between different stress treatments. C, Table showing the number of treatment-specific TIR-NBS-LRR genes found to be coexpressed within one treatment (shaded) and the number of commonly shared genes compared with coexpressed TIR-NBS-LRR genes of other stress conditions (not shaded). Conditions are as follows: heat (h), drought (d), TuMV (v), drought and heat (dh), TuMV and heat (vh), drought and TuMV (dv), TuMV, drought, and heat (vdh), and severe heat (severe h).
Figure 6.
Altered sugar accumulation and expression of invertase isoforms in multifactorial stressed plants. A, Transcriptional changes of PR genes and invertases expressed in different compartments under different stress conditions. Categorization was done according to data from Xiang et al. (2011). B to D, Levels of Suc, Fru, and Glc in differentially treated plants compared with control plants. Values represent means ±
sd
of three to four replicates for log2 values of the fold change compared with control plants. FW, Fresh weight. The colors saturate at 1.3-fold change. Red represents an increase and blue represents a decrease in transcript levels. n.d., Not determined. Statistically significant differences from control plants were determined using a two-tailed t test assuming a normal distribution and are indicated by asterisks (P < 0.05). Conditions are as follows: heat (h), drought (d), TuMV (v), drought and heat (dh), TuMV and heat (vh), drought and TuMV (dv), and TuMV, drought, and heat (vdh).
Figure 7.
Coexpression analysis of signaling genes under single and combined stress conditions. A, Number of differentially regulated genes according to the functional group “signaling” is given for each stress condition. B, Significant regulated signaling genes within the heat network from A visualized in a network of coexpressed genes provided by the ARANET Web tool (
). C, Table shows the number of treatment-specific signaling genes found to be coexpressed within one treatment (shaded) and the number of commonly shared genes compared with coexpressed signaling genes of other stress conditions (not shaded). Conditions are as follows: heat (h), drought (d), TuMV (v), drought and heat (dh), TuMV and heat (vh), drought and TuMV (dv), TuMV, drought, and heat (vdh), and severe heat (severe h).
Figure 8.
Expression pattern of CPR and UPR genes of plants exposed to single stress compared with multifactorial or severe heat stress. A, Diagram shows the distribution of HSFA2-regulated genes identified by Nishizawa et al. (2006) under single and multifactorial stress. B, Distribution of tunicamycin-regulated genes under different stress situations. Genes of five studies describing tunicamycin-regulated genes (Martinez and Chrispeels, 2003; Noh et al., 2003; Kamauchi et al., 2005; Iwata et al., 2008, 2010) were compared with genes differentially regulated under single and combined stress. Conditions are as follows: heat (h), drought (d), TuMV (v), drought and heat (dh), TuMV and heat (vh), drought and TuMV (dv), TuMV, drought, and heat (vdh), and severe heat (severe h).
Similar articles
- Relationships between drought, heat and air humidity responses revealed by transcriptome-metabolome co-analysis.
Georgii E, Jin M, Zhao J, Kanawati B, Schmitt-Kopplin P, Albert A, Winkler JB, Schäffner AR. Georgii E, et al. BMC Plant Biol. 2017 Jul 10;17(1):120. doi: 10.1186/s12870-017-1062-y. BMC Plant Biol. 2017. PMID: 28693422 Free PMC article. - Identification of genes involved in the response of Arabidopsis to simultaneous biotic and abiotic stresses.
Atkinson NJ, Lilley CJ, Urwin PE. Atkinson NJ, et al. Plant Physiol. 2013 Aug;162(4):2028-41. doi: 10.1104/pp.113.222372. Epub 2013 Jun 25. Plant Physiol. 2013. PMID: 23800991 Free PMC article. - Elevated carbon dioxide decreases the adverse effects of higher temperature and drought stress by mitigating oxidative stress and improving water status in Arabidopsis thaliana.
Abo Gamar MI, Kisiala A, Emery RJN, Yeung EC, Stone SL, Qaderi MM. Abo Gamar MI, et al. Planta. 2019 Oct;250(4):1191-1214. doi: 10.1007/s00425-019-03213-3. Epub 2019 Jun 12. Planta. 2019. PMID: 31190116 - Plant Immune System: Crosstalk Between Responses to Biotic and Abiotic Stresses the Missing Link in Understanding Plant Defence.
Nejat N, Mantri N. Nejat N, et al. Curr Issues Mol Biol. 2017;23:1-16. doi: 10.21775/cimb.023.001. Epub 2017 Feb 3. Curr Issues Mol Biol. 2017. PMID: 28154243 Review. - Multiple Functions of MYB Transcription Factors in Abiotic Stress Responses.
Wang X, Niu Y, Zheng Y. Wang X, et al. Int J Mol Sci. 2021 Jun 7;22(11):6125. doi: 10.3390/ijms22116125. Int J Mol Sci. 2021. PMID: 34200125 Free PMC article. Review.
Cited by
- A novel system for evaluating drought-cold tolerance of grapevines using chlorophyll fluorescence.
Su L, Dai Z, Li S, Xin H. Su L, et al. BMC Plant Biol. 2015 Mar 11;15:82. doi: 10.1186/s12870-015-0459-8. BMC Plant Biol. 2015. PMID: 25849490 Free PMC article. - Abiotic and Herbivory Combined Stress in Tomato: Additive, Synergic and Antagonistic Effects and Within-Plant Phenotypic Plasticity.
Vescio R, Caridi R, Laudani F, Palmeri V, Zappalà L, Badiani M, Sorgonà A. Vescio R, et al. Life (Basel). 2022 Nov 7;12(11):1804. doi: 10.3390/life12111804. Life (Basel). 2022. PMID: 36362960 Free PMC article. - Effects of Elevated Temperature on the Susceptibility of Capsicum Plants to Capsicum Chlorosis Virus Infection.
Tsai WA, Shafiei-Peters JR, Mitter N, Dietzgen RG. Tsai WA, et al. Pathogens. 2022 Feb 2;11(2):200. doi: 10.3390/pathogens11020200. Pathogens. 2022. PMID: 35215143 Free PMC article. - The Effects of Combined Abiotic and Pathogen Stress in Plants: Insights From Salinity and Pseudomonas syringae pv lachrymans Interaction in Cucumber.
Chojak-Koźniewska J, Kuźniak E, Zimny J. Chojak-Koźniewska J, et al. Front Plant Sci. 2018 Nov 20;9:1691. doi: 10.3389/fpls.2018.01691. eCollection 2018. Front Plant Sci. 2018. PMID: 30524462 Free PMC article. - Alfalfa Cellulose synthase gene expression under abiotic stress: a Hitchhiker's guide to RT-qPCR normalization.
Guerriero G, Legay S, Hausman JF. Guerriero G, et al. PLoS One. 2014 Aug 1;9(8):e103808. doi: 10.1371/journal.pone.0103808. eCollection 2014. PLoS One. 2014. PMID: 25084115 Free PMC article.
References
- Ahuja I, de Vos RC, Bones AM, Hall RD. (2010) Plant molecular stress responses face climate change. Trends Plant Sci 15: 664–674 - PubMed
- Alabadí D, Oyama T, Yanovsky MJ, Harmon FG, Más P, Kay SA. (2001) Reciprocal regulation between TOC1 and LHY/CCA1 within the Arabidopsis circadian clock. Science 293: 880–883 - PubMed
- Anderson JP, Badruzsaufari E, Schenk PM, Manners JM, Desmond OJ, Ehlert C, Maclean DJ, Ebert PR, Kazan K. (2004) Antagonistic interaction between abscisic acid and jasmonate-ethylene signaling pathways modulates defense gene expression and disease resistance in Arabidopsis. Plant Cell 16: 3460–3479 - PMC - PubMed
Publication types
MeSH terms
Substances
LinkOut - more resources
Full Text Sources
Other Literature Sources
Molecular Biology Databases


