MAVS regulates apoptotic cell death by decreasing K48-linked ubiquitination of voltage-dependent anion channel 1 - PubMed (original) (raw)
. 2013 Aug;33(16):3137-49.
doi: 10.1128/MCB.00030-13. Epub 2013 Jun 10.
Zirui Zheng, Ting Song, Xiang He, Changzhi Xu, Yanhong Zhang, Shengli Ma, Ying Wang, Quanbin Xu, Ye Cao, Jia Li, Xiaoli Yang, Xiaoxing Ge, Congwen Wei, Hui Zhong
Affiliations
- PMID: 23754752
- PMCID: PMC3753917
- DOI: 10.1128/MCB.00030-13
MAVS regulates apoptotic cell death by decreasing K48-linked ubiquitination of voltage-dependent anion channel 1
Kai Guan et al. Mol Cell Biol. 2013 Aug.
Abstract
The mitochondrial antiviral signaling protein MAVS (IPS-1, VISA, or Cardif) plays an important role in the host defense against viral infection by inducing type I interferon. Recent reports have shown that MAVS is also critical for virus-induced apoptosis. However, the mechanism of MAVS-mediated apoptosis induction remains unclear. Here, we show that MAVS binds to voltage-dependent anion channel 1 (VDAC1) and induces apoptosis by caspase-3 activation, which is independent of its role in innate immunity. MAVS modulates VDAC1 protein stability by decreasing its degradative K48-linked ubiquitination. In addition, MAVS knockout mouse embryonic fibroblasts (MEFs) display reduced VDAC1 expression with a consequent reduction of the vesicular stomatitis virus (VSV)-induced apoptosis response. Notably, the upregulation of VDAC1 triggered by VSV infection is completely abolished in MAVS knockout MEFs. We thus identify VDAC1 as a target of MAVS and describe a novel mechanism of MAVS control of virus-induced apoptotic cell death.
Figures
Fig 1
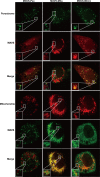
Targeting of MAVS to distinct subcellular compartments by replacement of its TM domain. Micrographs of MAVS−/− MEFs transfected with mutant MAVS proteins were stained with anti-MAVS antibody. Mitochondria were stained with MitoTracker. Peroxisomes were visualized with BacMam 2.0 CellLight reagents. Each images is representative of at least three independent experiments where >200 cells were examined per condition, and >95% of the cells displayed similar staining.
Fig 2
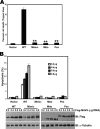
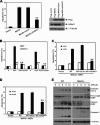
The TM domain is required for mediation of the proapoptotic activity of MAVS. (A) 293T cells transfected with expression plasmids encoding Flag-MAVS or mutant forms thereof were determined by trypan blue exclusion cell counting. **, P < 0.01. (B) 293T cells transfected with different amounts of Flag-MAVS or mutant forms thereof were analyzed by flow cytometry with annexin V staining. IB, immunoblotting.
Fig 3
Dimerization is required for mediation of the proapoptotic activity of MAVS. (A and B) 293T cells were treated with the pan-caspase inhibitor Z-VAD-FMK and then transfected with 0.2 μg of expression plasmids encoding Flag-MAVS or mutant forms thereof. Cell death and apoptosis were determined by trypan blue exclusion cell counting (A) and flow cytometry with annexin V staining (B), respectively. (C to E) 293T cells were transfected with IFN-β–luc (C), NF-κB–luc (D), or IRF-3–luc (E) together with Flag-MAVS or mutant forms thereof. Luciferase activity was measured 24 h later and normalized for transfection efficiency. Cell-based studies were performed at least three independent times with comparable results. The data shown are means ± the standard errors of the means. Student's t test was used for statistical analysis: **, P < 0.01. IB, immunoblotting.
Fig 4
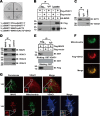
VDAC1 interacts with MAVS. (A) AH109 was cotransformed with the plasmids indicated. Positive interaction showed colony formation on synthetic medium lacking tryptophan, leucine, adenine, and histidine. (B) 293T cells were cotransfected with HA-MAVS and Flag-VDAC1 expression plasmids or Flag vector, and anti-Flag or -IgG immunoprecipitates were analyzed by immunoblotting (IB) with anti-HA or anti-Flag antibodies. (C) Lysates from 293T cells were subjected to immunoprecipitation (IP) with anti-GP73 or -IgG, fractionated by SDS-PAGE, and subsequently analyzed by immunoblotting with anti-VDAC1 antibody. (D) Lysates from 293T cells were subjected to immunoprecipitation with anti-MAVS or -IgG, fractionated by SDS-PAGE, and subsequently analyzed by immunoblotting with anti-VDAC1, anti-VDAC2, and anti-VDAC3 antibodies, respectively. (E) Anti-Flag or -IgG immunoprecipitates prepared from cells transfected with Flag-MAVS or Flag vector plasmid were subjected to SDS-PAGE and blotted onto nitrocellulose membrane. The nitrocellulose membrane was incubated with soluble GST-VDAC1 or GST for 2 h and then analyzed with anti-GST or anti-Flag antibody. (F) 293T cells transfected with an expression vector encoding Flag-VDAC1 were stained with anti-Flag antibody and imaged by confocal microscopy. The mitochondria were stained with MitoTracker. The yellow staining in the overlay image indicates colocalization of MAVS and MitoTracker. (G) Micrographs of MEFs stained with anti-MAVS and anti-VDAC1 antibodies. Mitochondria were stained with MitoTracker. Peroxisomes were visualized with BacMam 2.0 CellLight reagents. All of the images in all of the panels are representative of at least three independent experiments where over 200 cells were examined per condition, and >95% of the cells displayed similar staining. The values to the left of panels B to E are molecular sizes in kilodaltons.
Fig 5
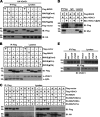
Characterization of the MAVS-VDAC1 interaction. (A and B) 293T cells were cotransfected with a Flag-tagged MAVS expression plasmid or Flag-tagged mutant MAVS expression plasmids with (A) or without (B) HA-VDAC1, and anti-Flag immunoprecipitates (IP) were analyzed by immunoblotting (IB) with anti-HA antibody (A), anti-Flag antibody, or anti-VDAC1 antibody (B). (C) 293T cells were cotransfected with Flag-VDAC1 and an HA-tagged MAVS expression plasmid or HA-tagged mutant MAVS expression plasmids, and anti-Flag immunoprecipitates were analyzed by immunoblotting with anti-HA or anti-Flag antibody. (D) 293T cells were cotransfected with Flag-MAVS and Myc-VDAC1 or Myc-mutant VDAC1; anti-Flag immunoprecipitates were analyzed by immunoblotting with anti-Myc or anti-Flag antibody. (E) 293T cells were cotransfected with a Flag-tagged MAVS expression plasmid or Flag-tagged mutant MAVS expression plasmids; anti-Flag immunoprecipitates were analyzed by immunoblotting with anti-VDAC1 or anti-Flag antibody. All coimmunoprecipitation experiments were performed independently two to three times with comparable results. The values to the left of the blots are molecular sizes in kilodaltons.
Fig 6
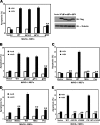
VDAC1 is required for mediation of the proapoptotic activity of MAVS. (A) 293T cells transfected with Flag-MAVS were transfected with scrambled siRNA or VDAC1 siRNA. Cell apoptosis was measured by annexin V staining 48 h later. (B) WT and MAVS−/− MEFs were infected with VSV at an MOI of 0.02 for 6 h or treated with ActD for 15 h in the presence or absence of Z-VAD. Cell apoptosis was measured by annexin V staining. (C and D) MAVS−/− MEFs transfected with Flag-MAVS were transfected with scrambled or VDAC1 siRNA. After 48 h, cells were infected with VSV at an MOI of 0.02 for 6 h (C) or treated with ActD for 15 h (D). Cell apoptosis was measured by annexin V staining. (E) Whole-cell lysates from WT and MAVS−/− MEFs infected with VSV at the indicated times were analyzed by immunoblotting (IB) with anti-Cyto C antibody, anti-PARP antibody, or anti-caspase-3 antibody. α-Tubulin was used as an equal-loading control (Ctrl). Cell-based studies were performed at least three independent times with comparable results. The data shown are means ± the standard errors of the means. Student's t test was used for statistical analysis: **, P < 0.01.
Fig 7
Binding of MAVS to VDAC1 is required for virus-induced cell apoptosis. (A, C, and E) MAVS−/− MEFs transfected with Flag-MAVS expression plasmid or Flag-tagged mutant MAVS proteins were infected with VSV at an MOI of 0.02. Cell apoptosis was measured by annexin V staining 6 h after VSV infection. (B and D) MAVS−/− MEFs transfected with Flag-MAVS expression plasmid or Flag-tagged mutant MAVS proteins were treated with ActD for 15 h. Cell apoptosis was measured by annexin V staining. Cell-based studies were performed at least three independent times with comparable results. The data shown are means ± the standard errors of the means. Student's t test was used for statistical analysis: **, P < 0.01. IB, immunoblotting.
Fig 8
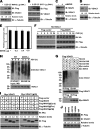
MAVS stabilizes VDAC1. (A) MCF-7 cells were transfected with plasmids expressing increasing amount of Flag-MAVS. Whole-cell lysates were analyzed by immunoblotting (IB) with anti-Flag or anti-VDAC1 antibody. α-Tubulin was used as an equal-loading control. (B) MCF-7 cells were transfected with plasmids expressing increasing amount of Flag-GP73. Whole-cell lysates were analyzed by immunoblotting with anti-Flag or anti-VDAC1 antibody. α-Tubulin was used as an equal-loading control. (C) MCF-7 cells transfected with small interfering MAVS (siMAVS) or small interfering scrambled oligonucleotides were analyzed by immunoblotting with anti-MAVS or anti-VDAC1 antibody. α-Tubulin was used as an equal-loading control. (D) Whole-cell lysates from WT and MAVS−/− MEFs were analyzed by immunoblotting with anti-VDAC1 antibodies. α-Tubulin was used as an equal-loading control. (E) MCF-7 cells were transfected with different doses of MAVS expression plasmids. RNA was extracted 24 h later, and the VDAC1 mRNA level was analyzed by quantitative real-time PCR. (F) 293T cells were transfected with the expression vector encoding HA-VDAC1 together with Flag-MAVS or Flag vector. After 24 h, cells were treated with cycloheximide (50 μM). The level of VDAC1 was monitored by immunoblotting with anti-HA antibody. α-Tubulin was used as an equal-loading control. (G) Flag-VDAC1 and Myc-MAVS were cotransfected with plasmids encoding HA-tagged ubiquitin (HA-Ub), HA-tagged K48 ubiquitin (HA-Ub K48) or HA-tagged K63 ubiquitin (HA-Ub K63). Cells were grown in DMEM containing MG132 (20 μM) for 6 h. Anti-Flag immunoprecipitates were analyzed by immunoblotting with anti-HA antibody. Whole-cell lysates were subjected to immunoblotting with anti-Myc and anti-Flag antibodies. α-Tubulin was used as an equal-loading control. (H) WT and MAVS−/− MEFs were infected with VSV at an MOI of 0.02 for the indicated times. Anti-VDAC1 immunoprecipitates were analyzed by immunoblotting with anti-VDAC1 or anti-K48-Ub antibody. (I and J) MCF-7 cells were transfected with the plasmids indicated. Whole-cell lysates were analyzed by immunoblotting with anti-Flag or anti-Myc antibody. α-Tubulin was used as an equal-loading control. Cell-based studies were performed at least three independent times with comparable results. The values below certain Western blots (WB) are relative levels determined by software-based quantification of the representative experiment shown. The data shown are means ± the standard errors of the means.
Fig 9
MAVS-VDAC1 interaction is required for inhibition of VDAC1 K48 polyubiquitination. (A and B) Flag-VDAC1, Myc-MAVS, and Myc–MAVS-Mimic (A) or Flag-VDAC2 (B) were cotransfected with plasmids encoding HA-tagged K48 ubiquitin (HA-Ub K48). Cells were grown in DMEM containing MG132 (20 μM) for 6 h. Anti-Flag immunoprecipitates (IP) were analyzed by immunoblotting (IB) with anti-HA antibody. Whole-cell lysates were subjected to immunoblotting with anti-Myc and anti-Flag antibodies. The values to the left of the blots are molecular sizes in kilodaltons. WB, Western blot.
Fig 10
VDAC1 upregulation and oligomerization in response to VSV infection require MAVS. (A) WT and MAVS−/− MEFs infected with VSV for the times indicated were analyzed by immunoblotting (IB) with anti-VDAC1 antibody. α-Tubulin was used as an equal-loading control. (B) MCF-7 cells transfected with small interfering MAVS (siMAVS) or small interfering scrambled oligonucleotides were treated with ActD for 15 h. Whole-cell lysates were analyzed by immunoblotting with anti-VDAC1 antibody. α-Tubulin was used as an equal-loading control (Ctrl). (C and D) Control siRNA (siCtrl)- and MAVS siRNA-transfected 293T cells (C) WT MAVS, and MAVS−/− MEFs (D) were treated with VSV for 6 h. Cells (2.5 to 3 mg/ml) washed with PBS were incubated with DFDNB (0.1 mM) at 30°C for 30 min and then subjected to SDS-PAGE and immunoblotting with anti-VDAC1 antibodies. The positions of VDAC1 monomers and multimers are indicated. Cell-based studies were performed at least three independent times with comparable results. The values below certain Western blots are relative levels determined by software-based quantification of the representative experiment shown. The data shown are means ± the standard errors of the means. The values to the left of panels C and D are molecular sizes in kilodaltons.
Similar articles
- Negative Regulation of RNF90 on RNA Virus-Triggered Antiviral Immune Responses Targeting MAVS.
Yang B, Zhang G, Qin X, Huang Y, Ren X, Sun J, Ma S, Liu Y, Song D, Liu Y, Cui Y, Wang H, Wang J. Yang B, et al. Front Immunol. 2021 Aug 27;12:730483. doi: 10.3389/fimmu.2021.730483. eCollection 2021. Front Immunol. 2021. PMID: 34512666 Free PMC article. - STAT6 promotes innate immunity against BEFV and VSV by inhibiting STUB1 and NIX-mediated MAVS degradation.
Zhang F, Wang H, He H, Hou P. Zhang F, et al. Vet Microbiol. 2024 Nov;298:110290. doi: 10.1016/j.vetmic.2024.110290. Epub 2024 Oct 25. Vet Microbiol. 2024. PMID: 39471658 - Induction of OTUD4 by viral infection promotes antiviral responses through deubiquitinating and stabilizing MAVS.
Liuyu T, Yu K, Ye L, Zhang Z, Zhang M, Ren Y, Cai Z, Zhu Q, Lin D, Zhong B. Liuyu T, et al. Cell Res. 2019 Jan;29(1):67-79. doi: 10.1038/s41422-018-0107-6. Epub 2018 Nov 8. Cell Res. 2019. PMID: 30410068 Free PMC article. - VDAC1, mitochondrial dysfunction, and Alzheimer's disease.
Shoshan-Barmatz V, Nahon-Crystal E, Shteinfer-Kuzmine A, Gupta R. Shoshan-Barmatz V, et al. Pharmacol Res. 2018 May;131:87-101. doi: 10.1016/j.phrs.2018.03.010. Epub 2018 Mar 15. Pharmacol Res. 2018. PMID: 29551631 Review. - The mitochondrial voltage-dependent anion channel 1 in tumor cells.
Shoshan-Barmatz V, Ben-Hail D, Admoni L, Krelin Y, Tripathi SS. Shoshan-Barmatz V, et al. Biochim Biophys Acta. 2015 Oct;1848(10 Pt B):2547-75. doi: 10.1016/j.bbamem.2014.10.040. Epub 2014 Nov 4. Biochim Biophys Acta. 2015. PMID: 25448878 Review.
Cited by
- Emerging complexity and new roles for the RIG-I-like receptors in innate antiviral immunity.
Errett JS, Gale M. Errett JS, et al. Virol Sin. 2015 Jun;30(3):163-73. doi: 10.1007/s12250-015-3604-5. Epub 2015 May 20. Virol Sin. 2015. PMID: 25997992 Free PMC article. Review. - Fungal-Mediated Silver Nanoparticle and Biochar Synergy against Colorectal Cancer Cells and Pathogenic Bacteria.
Alqaraleh M, Khleifat KM, Abu Hajleh MN, Farah HS, Ahmed KA. Alqaraleh M, et al. Antibiotics (Basel). 2023 Mar 16;12(3):597. doi: 10.3390/antibiotics12030597. Antibiotics (Basel). 2023. PMID: 36978464 Free PMC article. - E3 ubiquitin ligase TRIM31 alleviates dopaminergic neurodegeneration by promoting proteasomal degradation of VDAC1 in Parkinson's Disease model.
Zhao Z, Song X, Wang Y, Yu L, Huang G, Li Y, Zong R, Liu T, Ji Q, Zheng Y, Liu B, Zhu Q, Chen L, Gao C, Liu H. Zhao Z, et al. Cell Death Differ. 2024 Nov;31(11):1410-1421. doi: 10.1038/s41418-024-01334-1. Epub 2024 Jun 25. Cell Death Differ. 2024. PMID: 38918620 - VDAC1 at the Intersection of Cell Metabolism, Apoptosis, and Diseases.
Shoshan-Barmatz V, Shteinfer-Kuzmine A, Verma A. Shoshan-Barmatz V, et al. Biomolecules. 2020 Oct 26;10(11):1485. doi: 10.3390/biom10111485. Biomolecules. 2020. PMID: 33114780 Free PMC article. Review. - Highly Pathogenic Porcine Reproductive and Respiratory Syndrome Virus Nsp4 Cleaves VISA to Impair Antiviral Responses Mediated by RIG-I-like Receptors.
Huang C, Du Y, Yu Z, Zhang Q, Liu Y, Tang J, Shi J, Feng WH. Huang C, et al. Sci Rep. 2016 Jun 22;6:28497. doi: 10.1038/srep28497. Sci Rep. 2016. PMID: 27329948 Free PMC article.
References
- Goldenthal MJ, Marin-Garcia J. 2004. Mitochondrial signaling pathways: a receiver/integrator organelle. Mol. Cell. Biochem. 262:1–16 - PubMed
- Green DR, Reed JC. 1998. Mitochondria and apoptosis. Science 281:1309–1312 - PubMed
- Meylan E, Curran J, Hofmann K, Moradpour D, Binder M, Bartenschlager R, Tschopp J. 2005. Cardif is an adaptor protein in the RIG-I antiviral pathway and is targeted by hepatitis C virus. Nature 437:1167–1172 - PubMed
- Ow YP, Green DR, Hao Z, Mak TW. 2008. Cytochrome c: functions beyond respiration. Nat. Rev. Mol. Cell Biol. 9:532–542 - PubMed
Publication types
MeSH terms
Substances
LinkOut - more resources
Full Text Sources
Other Literature Sources
Molecular Biology Databases
Research Materials
Miscellaneous
