Inferring demographic history from a spectrum of shared haplotype lengths - PubMed (original) (raw)
Inferring demographic history from a spectrum of shared haplotype lengths
Kelley Harris et al. PLoS Genet. 2013 Jun.
Abstract
There has been much recent excitement about the use of genetics to elucidate ancestral history and demography. Whole genome data from humans and other species are revealing complex stories of divergence and admixture that were left undiscovered by previous smaller data sets. A central challenge is to estimate the timing of past admixture and divergence events, for example the time at which Neanderthals exchanged genetic material with humans and the time at which modern humans left Africa. Here, we present a method for using sequence data to jointly estimate the timing and magnitude of past admixture events, along with population divergence times and changes in effective population size. We infer demography from a collection of pairwise sequence alignments by summarizing their length distribution of tracts of identity by state (IBS) and maximizing an analytic composite likelihood derived from a Markovian coalescent approximation. Recent gene flow between populations leaves behind long tracts of identity by descent (IBD), and these tracts give our method power by influencing the distribution of shared IBS tracts. In simulated data, we accurately infer the timing and strength of admixture events, population size changes, and divergence times over a variety of ancient and recent time scales. Using the same technique, we analyze deeply sequenced trio parents from the 1000 Genomes project. The data show evidence of extensive gene flow between Africa and Europe after the time of divergence as well as substructure and gene flow among ancestral hominids. In particular, we infer that recent African-European gene flow and ancient ghost admixture into Europe are both necessary to explain the spectrum of IBS sharing in the trios, rejecting simpler models that contain less population structure.
Conflict of interest statement
The authors have declared that no competing interests exist.
Figures
Figure 1. An eight base-pair tract of identity by state (IBS).
Figure 2. Spectra of IBS sharing between simulated populations that differ only in admixture time.
Each of the colored tract spectra in Figure 2A was generated from  base pairs of sequence alignment simulated with Hudson's MS . The IBS tracts are shared between two populations of constant size 10,000 that diverged 2,000 generations ago, with one haplotype sampled from each population. 5% of the genetic material from one population is the product of a recent admixture pulse from the other population. Figure 2B illustrates the history being simulated. When the admixture occurred less than 1,000 generations ago, it noticeably increases the abundance of long IBS tracts. The gray lines in 2A are theoretical tract abundance predictions, and fit the simulated data extremely well. To smooth out noise in the simulated data, abundances are averaged over intervals with exponentially spaced endpoints
  .
.
Figure 3. Shared IBS tracts within bottlenecked populations.
As in Figure 2, each colored spectrum in Figure 3A was generated by using MS to simulate  base pairs of pairwise alignment. Both sequences are derived from the population depicted in Figure 3B that underwent a bottleneck from size
  to size
  , the duration of the bottleneck being
  generations. 1,000 generations ago, the population recovered to size 10,000. These bottlenecks leave similar frequencies of very long and very short IBS tracts because they have identical ratios of strength to duration, but they leave different signature increases compared to the no-bottleneck history in the abundance of
  –
– -base IBS tracts. In grey are the expected IBS tract spectra that we predict analytically for each simulated history.
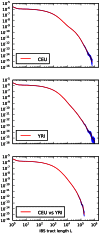
Figure 4. Frequencies of IBS tracts shared between the 1000 Genomes trio parental haplotypes.
Each plot records the number of  -base IBS tracts observed per base pair of sequence alignment. The red spectrum records tract frequencies compiled from the entire alignment, while the blue spectra result from 100 repetitions of block bootstrap resampling. A slight upward concavity around
  base pairs is the signature of the out of Africa bottleneck in Europeans.
Figure 5. IBS tract lengths in the 1000 Genomes pilot data: trios v. low coverage.
These IBS tract spectra were generated from pairwise alignments of the 1000 Genomes high coverage trio parental haplotypes and the CEU (European) and YRI (Yoruban) low coverage haplotypes, aligning samples within each population and between the two populations. Due to excess sequencing and phasing errors, the low coverage alignments have excess closely spaced SNPs and too few long shared IBS tracts. Despite this, frequencies of tracts between 1 and 100 kB are very similar between the two datasets and diagnostic of population identity.
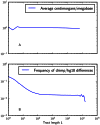
Figure 6. Mutation and recombination rates within -base IBS tracts.
Figure 6A shows that there is no length class of IBS tracts with a significantly higher or lower mutation rate than the genome-wide average (recombination rates are taken from the deCODE genetic map [53]). In contrast, Figure 6B shows that IBS tracts shorter than 100 base pairs occur in regions with higher rates of human-chimp differences than the genomewide average. These plots were made using IBS tracts shared between Europeans and Africans, but the results are similar for IBS sharing within each of the populations.
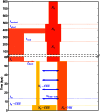
Figure 7. A history inferred from IBS sharing in Europeans and Yorubans.
This is the simplest history we found to satisfactorily explain IBS tract sharing in the 1000 Genomes trio data. It includes ancient ancestral population size changes, an out-of-African bottleneck in Europeans, ghost admixture into Europe from an ancestral hominid, and a long period of gene flow between the diverging populations.
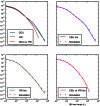
Figure 8. Accurate prediction of IBS sharing in the trio data.
The upper left hand panel summarizes IBS tracts shared within the European and Yoruban 1000 Genomes trio parents, as well as IBS tract sharing between the two groups. The remaining three panels compare these real data to data simulated according to the history from Figure 7 with the maximum likelihood parameters from Table 2.
Figure 9. The coalescent with recombination and the sequentially Markov coalescent associate an observed pair of DNA sequences with a history that specifies a time to most recent common ancestry for each base pair.
Polymorphisms are caused by mutation events, while changes in TMRCA are caused by recombination events.
Figure 10. An -base IBS tract with three recombination events in its history.
A blue skyline profile represents the hidden coalescence history of this idealized IBS tract. In order to predict the frequency of these tracts in a sequence alignment, we must integrate over the coalesence times  as well as the times
  ,
,  , and
, and  when recombinations occurred.
Similar articles
- Identification of African-Specific Admixture between Modern and Archaic Humans.
Wall JD, Ratan A, Stawiski E; GenomeAsia 100K Consortium. Wall JD, et al. Am J Hum Genet. 2019 Dec 5;105(6):1254-1261. doi: 10.1016/j.ajhg.2019.11.005. Am J Hum Genet. 2019. PMID: 31809748 Free PMC article. - IBD Sharing between Africans, Neandertals, and Denisovans.
Povysil G, Hochreiter S. Povysil G, et al. Genome Biol Evol. 2016 Dec 1;8(12):3406-3416. doi: 10.1093/gbe/evw234. Genome Biol Evol. 2016. PMID: 28158547 Free PMC article. - Effect of ancient population structure on the degree of polymorphism shared between modern human populations and ancient hominins.
Eriksson A, Manica A. Eriksson A, et al. Proc Natl Acad Sci U S A. 2012 Aug 28;109(35):13956-60. doi: 10.1073/pnas.1200567109. Epub 2012 Aug 14. Proc Natl Acad Sci U S A. 2012. PMID: 22893688 Free PMC article. - Archaic admixture in human history.
Wall JD, Yoshihara Caldeira Brandt D. Wall JD, et al. Curr Opin Genet Dev. 2016 Dec;41:93-97. doi: 10.1016/j.gde.2016.07.002. Epub 2016 Sep 20. Curr Opin Genet Dev. 2016. PMID: 27662059 Review. - Archaic hominin introgression into modern human genomes.
Gokcumen O. Gokcumen O. Am J Phys Anthropol. 2020 May;171 Suppl 70:60-73. doi: 10.1002/ajpa.23951. Epub 2019 Nov 8. Am J Phys Anthropol. 2020. PMID: 31702050 Review.
Cited by
- Biases in ARG-Based Inference of Historical Population Size in Populations Experiencing Selection.
Marsh JI, Johri P. Marsh JI, et al. Mol Biol Evol. 2024 Jul 3;41(7):msae118. doi: 10.1093/molbev/msae118. Mol Biol Evol. 2024. PMID: 38874402 Free PMC article. - Modeling the mosaic structure of bacterial genomes to infer their evolutionary history.
Sheinman M, Arndt PF, Massip F. Sheinman M, et al. Proc Natl Acad Sci U S A. 2024 Mar 26;121(13):e2313367121. doi: 10.1073/pnas.2313367121. Epub 2024 Mar 22. Proc Natl Acad Sci U S A. 2024. PMID: 38517978 Free PMC article. - Dynamics of bacterial recombination in the human gut microbiome.
Liu Z, Good BH. Liu Z, et al. PLoS Biol. 2024 Feb 8;22(2):e3002472. doi: 10.1371/journal.pbio.3002472. eCollection 2024 Feb. PLoS Biol. 2024. PMID: 38329938 Free PMC article. - Haplotype-based inference of recent effective population size in modern and ancient DNA samples.
Fournier R, Tsangalidou Z, Reich D, Palamara PF. Fournier R, et al. Nat Commun. 2023 Dec 1;14(1):7945. doi: 10.1038/s41467-023-43522-6. Nat Commun. 2023. PMID: 38040695 Free PMC article. - Expanding the stdpopsim species catalog, and lessons learned for realistic genome simulations.
Lauterbur ME, Cavassim MIA, Gladstein AL, Gower G, Pope NS, Tsambos G, Adrion J, Belsare S, Biddanda A, Caudill V, Cury J, Echevarria I, Haller BC, Hasan AR, Huang X, Iasi LNM, Noskova E, Obsteter J, Pavinato VAC, Pearson A, Peede D, Perez MF, Rodrigues MF, Smith CCR, Spence JP, Teterina A, Tittes S, Unneberg P, Vazquez JM, Waples RK, Wohns AW, Wong Y, Baumdicker F, Cartwright RA, Gorjanc G, Gutenkunst RN, Kelleher J, Kern AD, Ragsdale AP, Ralph PL, Schrider DR, Gronau I. Lauterbur ME, et al. Elife. 2023 Jun 21;12:RP84874. doi: 10.7554/eLife.84874. Elife. 2023. PMID: 37342968 Free PMC article.
References
- Templeton A (2002) Out of Africa again and again. Nature 416: 45–51. - PubMed
Publication types
MeSH terms
LinkOut - more resources
Full Text Sources
Other Literature Sources
Miscellaneous


