Comprehensive genotyping of the USA national maize inbred seed bank - PubMed (original) (raw)
doi: 10.1186/gb-2013-14-6-r55.
Mark J Millard, Jeffrey C Glaubitz, Jason A Peiffer, Kelly L Swarts, Terry M Casstevens, Robert J Elshire, Charlotte B Acharya, Sharon E Mitchell, Sherry A Flint-Garcia, Michael D McMullen, James B Holland, Edward S Buckler, Candice A Gardner
- PMID: 23759205
- PMCID: PMC3707059
- DOI: 10.1186/gb-2013-14-6-r55
Comprehensive genotyping of the USA national maize inbred seed bank
Maria C Romay et al. Genome Biol. 2013.
Abstract
Background: Genotyping by sequencing, a new low-cost, high-throughput sequencing technology was used to genotype 2,815 maize inbred accessions, preserved mostly at the National Plant Germplasm System in the USA. The collection includes inbred lines from breeding programs all over the world.
Results: The method produced 681,257 single-nucleotide polymorphism (SNP) markers distributed across the entire genome, with the ability to detect rare alleles at high confidence levels. More than half of the SNPs in the collection are rare. Although most rare alleles have been incorporated into public temperate breeding programs, only a modest amount of the available diversity is present in the commercial germplasm. Analysis of genetic distances shows population stratification, including a small number of large clusters centered on key lines. Nevertheless, an average fixation index of 0.06 indicates moderate differentiation between the three major maize subpopulations. Linkage disequilibrium (LD) decays very rapidly, but the extent of LD is highly dependent on the particular group of germplasm and region of the genome. The utility of these data for performing genome-wide association studies was tested with two simply inherited traits and one complex trait. We identified trait associations at SNPs very close to known candidate genes for kernel color, sweet corn, and flowering time; however, results suggest that more SNPs are needed to better explore the genetic architecture of complex traits.
Conclusions: The genotypic information described here allows this publicly available panel to be exploited by researchers facing the challenges of sustainable agriculture through better knowledge of the nature of genetic diversity.
Figures
Figure 1
distribution of single-nucleotide polymorphisms (SNPs) across the genome. Distribution of the number of SNPs found in 1 Mb windows across the 10 maize chromosomes. Centromere positions are shown in black.
Figure 2
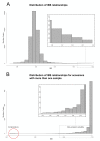
Identical by state (IBS) distribution across GBS samples. Distribution of IBS values across (A) the 2,815 accessions and (B) for accessions with multiple samples.
Figure 3
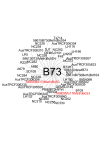
B73 network diagram. Network relationships of maize inbred lines with values of IBS greater than 0.97 for B73.
Figure 4
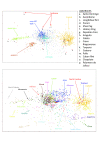
Multidimensional scanning for 2,815 maize inbred lines. Genetic relationships between the maize inbred lines preserved at the NCRPIS germplasm bank visualized using a principal coordinate analysis of the distances matrix. The × and Y axes represent PCo1 and PCo2 respectively. Colors are assigned based on (A) population structure or (B) breeding program. Inbred lines obtained directly from landraces without selection are highlighted in red to serve as reference.
Figure 5
Minor allele frequency (MAF) distribution and percentage of single-nucleotide polymorphisms (SNPs) shared between maize subpopulations. Histogram of MAF distribution over all groups, and cumulative percentage of SNPs shared between different groups of germplasm for each class of MAF. Columns represent the percentage of SNPs in each MAF category; lines represent the percentage of alleles shared between the groups of germplasm at equal or lesser MAF value.
Figure 6
Expired Plant Variety Protection (ExPVP) network diagram and distribution of segregating single-nucleotide polymorphism (SNPs). (A) Network of relationships for the ExPVP inbreds constructed using identical by state (IBS) values greater than 0.9. Each dot (inbred line) has a different color assigned based on the company where it was developed. (B) Distribution of the segregating SNPs between the three heterotic groups that form the three main clusters in the network graph.
Figure 7
Genome-wide pairwise relationships between different genetic diversity measurements. Relationships between nested association mapping (NAM) recombination rate (log10 cM/Mb), average haplotype length (bp), average LD (_r_2), and fixation indexes (Fst) between stiff stalk, non-stiff stalk, and tropical lines at the NAM genetic map bin scale. The numbers indicate the coefficient of determination (_r_2) calculated using Spearman's rank correlation. LD, linkage disequilibrium.
Figure 8
Decline of genome-wide linkage disequilibrium (LD) across all maize inbreds. Mean LD decay measured as pairwise _r_2 between all single-nucleotide polymorphisms in the collection. The red line represents the average value while the darker gray area represents the 50% range of values and light gray 90%.
Figure 9
Genome-wide association study (GWAS) for yellow versus white kernels. GWAS for kernel color on 1,595 maize inbred lines with yellow or white kernels.
Figure 10
Genome-wide association study (GWAS) for sweet versus starchy corn. GWAS for kernel color on 2,145 maize inbred lines with sweet or starchy kernels. SNP, single-nucleotide polymorphism.
Figure 11
Genome-wide association study (GWAS) for growing degree days to silking. GWAS for growing degree days to 50% silking on 2,279 maize inbred lines. NAM, nested association mapping; QTL, quantitative trait loci.
Similar articles
- Diversity in global maize germplasm: characterization and utilization.
Prasanna BM. Prasanna BM. J Biosci. 2012 Nov;37(5):843-55. doi: 10.1007/s12038-012-9227-1. J Biosci. 2012. PMID: 23107920 Review. - Genomic characterization of a core set of the USDA-NPGS Ethiopian sorghum germplasm collection: implications for germplasm conservation, evaluation, and utilization in crop improvement.
Cuevas HE, Rosa-Valentin G, Hayes CM, Rooney WL, Hoffmann L. Cuevas HE, et al. BMC Genomics. 2017 Jan 26;18(1):108. doi: 10.1186/s12864-016-3475-7. BMC Genomics. 2017. PMID: 28125967 Free PMC article. - DArTseq-Based High-Throughput SilicoDArT and SNP Markers Applied for Association Mapping of Genes Related to Maize Morphology.
Tomkowiak A, Bocianowski J, Spychała J, Grynia J, Sobiech A, Kowalczewski PŁ. Tomkowiak A, et al. Int J Mol Sci. 2021 May 29;22(11):5840. doi: 10.3390/ijms22115840. Int J Mol Sci. 2021. PMID: 34072515 Free PMC article. - Characterizing the population structure and genetic diversity of maize breeding germplasm in Southwest China using genome-wide SNP markers.
Zhang X, Zhang H, Li L, Lan H, Ren Z, Liu D, Wu L, Liu H, Jaqueth J, Li B, Pan G, Gao S. Zhang X, et al. BMC Genomics. 2016 Aug 31;17(1):697. doi: 10.1186/s12864-016-3041-3. BMC Genomics. 2016. PMID: 27581193 Free PMC article. - Digital techniques and trends for seed phenotyping using optical sensors.
Liu F, Yang R, Chen R, Lamine Guindo M, He Y, Zhou J, Lu X, Chen M, Yang Y, Kong W. Liu F, et al. J Adv Res. 2024 Sep;63:1-16. doi: 10.1016/j.jare.2023.11.010. Epub 2023 Nov 11. J Adv Res. 2024. PMID: 37956859 Free PMC article. Review.
Cited by
- Multi-locus genome-wide association study for phosphorus use efficiency in a tropical maize germplasm.
Zeffa DM, Júnior LP, de Assis R, Delfini J, Marcos AW, Koltun A, Baba VY, Constantino LV, Uhdre RS, Nogueira AF, Moda-Cirino V, Scapim CA, Gonçalves LSA. Zeffa DM, et al. Front Plant Sci. 2024 Aug 23;15:1366173. doi: 10.3389/fpls.2024.1366173. eCollection 2024. Front Plant Sci. 2024. PMID: 39246817 Free PMC article. - Sorghum Association Panel whole-genome sequencing establishes cornerstone resource for dissecting genomic diversity.
Boatwright JL, Sapkota S, Jin H, Schnable JC, Brenton Z, Boyles R, Kresovich S. Boatwright JL, et al. Plant J. 2022 Aug;111(3):888-904. doi: 10.1111/tpj.15853. Epub 2022 Jul 5. Plant J. 2022. PMID: 35653240 Free PMC article. - Genomic prediction in maize breeding populations with genotyping-by-sequencing.
Crossa J, Beyene Y, Kassa S, Pérez P, Hickey JM, Chen C, de los Campos G, Burgueño J, Windhausen VS, Buckler E, Jannink JL, Lopez Cruz MA, Babu R. Crossa J, et al. G3 (Bethesda). 2013 Nov 6;3(11):1903-26. doi: 10.1534/g3.113.008227. G3 (Bethesda). 2013. PMID: 24022750 Free PMC article. - A genome-wide association study of the maize hypersensitive defense response identifies genes that cluster in related pathways.
Olukolu BA, Wang GF, Vontimitta V, Venkata BP, Marla S, Ji J, Gachomo E, Chu K, Negeri A, Benson J, Nelson R, Bradbury P, Nielsen D, Holland JB, Balint-Kurti PJ, Johal G. Olukolu BA, et al. PLoS Genet. 2014 Aug 28;10(8):e1004562. doi: 10.1371/journal.pgen.1004562. eCollection 2014 Aug. PLoS Genet. 2014. PMID: 25166276 Free PMC article. - Sequence and ionomic analysis of divergent strains of maize inbred line B73 with an altered growth phenotype.
Mascher M, Gerlach N, Gahrtz M, Bucher M, Scholz U, Dresselhaus T. Mascher M, et al. PLoS One. 2014 May 7;9(5):e96782. doi: 10.1371/journal.pone.0096782. eCollection 2014. PLoS One. 2014. PMID: 24804793 Free PMC article.
References
- FAOSTAT. http://faostat.fao.org
- Chia J-M, Song C, Bradbury PJ, Costich D, De Leon N, Doebley J, Elshire RJ, Gaut B, Geller L, Glaubitz JC, Gore M, Guill KE, Holland J, Hufford MB, Lai J, Li M, Liu X, Lu Y, McCombie R, Nelson R, Poland J, Prasanna BM, Pyhäjärvi T, Rong T, Sekhon RS, Sun Q, Tenaillon MI, Tian F, Wang J, Xu X. et al.Maize HapMap2 identifies extant variation from a genome in flux. Nat Genet. 2012;44:803–807. doi: 10.1038/ng.2313. - DOI - PubMed
- Shull GH. The composition of a field of maize. American Breeders Association Report. 1908;4:296–301.
MeSH terms
Substances
LinkOut - more resources
Full Text Sources
Other Literature Sources
Research Materials


