Autophagy failure in Alzheimer's disease and the role of defective lysosomal acidification - PubMed (original) (raw)
Autophagy failure in Alzheimer's disease and the role of defective lysosomal acidification
Devin M Wolfe et al. Eur J Neurosci. 2013 Jun.
Abstract
Autophagy is a lysosomal degradative process which recycles cellular waste and eliminates potentially toxic damaged organelles and protein aggregates. The important cytoprotective functions of autophagy are demonstrated by the diverse pathogenic consequences that may stem from autophagy dysregulation in a growing number of neurodegenerative disorders. In many of the diseases associated with autophagy anomalies, it is the final stage of autophagy-lysosomal degradation that is disrupted. In several disorders, including Alzheimer's disease (AD), defective lysosomal acidification contributes to this proteolytic failure. The complex regulation of lysosomal pH makes this process vulnerable to disruption by many factors, and reliable lysosomal pH measurements have become increasingly important in investigations of disease mechanisms. Although various reagents for pH quantification have been developed over several decades, they are not all equally well suited for measuring the pH of lysosomes. Here, we evaluate the most commonly used pH probes for sensitivity and localisation, and identify LysoSensor yellow/blue-dextran, among currently used probes, as having the optimal profile of properties for measuring lysosomal pH. In addition, we review evidence that lysosomal acidification is defective in AD and extend our original findings, of elevated lysosomal pH in presenilin 1 (PS1)-deficient blastocysts and neurons, to additional cell models of PS1 and PS1/2 deficiency, to fibroblasts from AD patients with PS1 mutations, and to neurons in the PS/APP mouse model of AD.
© 2013 Federation of European Neuroscience Societies and John Wiley & Sons Ltd.
Conflict of interest statement
The authors have no conflict of interest to declare.
Figures
Figure 1
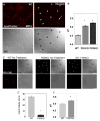
Assessment of commonly utilized pH sensitive probes (A) WT blastocyst derived cells (BD) were stained for 3 hours with fluorescein-dextran after which no observable signal was detected via confocal microscopy. While Alexafluor 546-dextran yielded a clear punctate signal. (B) Lysosensor yellow/blue-dextran signals were colocalized with Alexafluor 546-dextran under triple labeling (arrows). In these images, 523 nm emission for yellow signal was converted to pseudo-green. (C) Lysosensor Yellow/Blue DND-160 demonstrated a more random localization with only a fraction of the blue signal, which indicate fewer acidic organelles colocalizing with the Alexfluor 546-dextran. Moreover, the intensity of the blue signal from the Lysosensor was elevated, indicating a more alkaline lysosome. In these images, 523 nm emissions for yellow signal were converted to pseudo-green. (D) The majority of the pHrodo-dextran signal colocalized with Alexafluor 488-dextran in the lysosome (arrow). Scale bar is 50 μm.
Figure 2
Lysosomal acidification is affected in PS1/2 DKO MEF cells: (A) PSDKO MEFs exhibit decreased LysoTracker-Red signal compared to WT MEFs. Rare PS1/2 DKO cells exhibiting strong LysoTracker red signal (<2% of total population) were seen in some fields. After incubation with 100nM LysoTracker Red DND-99, cells were washed with PBS and immediately imaged using LSM 510 META confocal microscopy and imaged by phase contrast microscopy. (DIC- differential interference contrast). Arrowheads indicate individual cells. An arrow depicts a rare PSDKO cell displaying unusually high LysoTracker signal. (B) Lysosomal pH is elevated in PS1KO and PDKO MEFs. (C) In vivo Cat B activity assays using MR-cathepsin. PS1/2 DKO MEF exhibit markedly decreased MR-CatB signal compared to WT MEFs. PS1/2 DKO MEFs displaying normal MR-CatB signals were rarely seen similar to the pattern in NH4Cl treated WT MEFs. Arrowheads indicate individual cells. The bottom panels in each image set depict higher magnifications showing a representative single cell from the cell populations in the upper panels. Scale bars represent 50 μm (upper panel) and 10 μm (bottom panel). (D) In vitro assays of Cat B enzyme activity in PS1/2 DKO MEF lysates is also decreased compared to that in control cells. (E) Lysosomal pH is elevated in PS1 FAD patient fibroblasts (Cell line 6840). Lysosomal pH was determined fluorometrically using Dextran conjugated LysoSensor DND-160 Yellow/Blue. Quantitative data are presented as means ±S.E.M. for 3 different experiments. * p<0.0001.
Figure 3
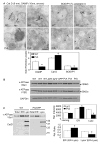
Autophagosome accumulation and defective acidification in PS/APP mice. (A) DAMP, a marker which localizes to acidic compartments, was infused intraventricularly into the brains of mice, which were then analyzed by immuno-electron microscopy using DNP (10 nm-gold) and CatD (6 nm-gold) (top panel) or Bodipy-FL (10 nm-gold, bottom panel) antibodies. Graphs show quantitative results of immunogold labeling for DAMP, CatD, and Bodipy-FL-Pepstain A. (B) v-ATPase V0a1 subunit immunoblotting of brains of 10 month old PS/APP show similar levels of the mature form compared to WT controls. However, the amount of ATPase was significantly decreased in the lysosomal fraction (C). Quantitative data are presented as means ±S.E.M. for 3 different experiments. * p < 0.001. Scale bars equal 500 nm.
Figure 4
Schematic representation of the lysosome dysfunction mediated by pH alteration. Increased lysosomal pH leads to reduced lysosomal degradation of lipid or toxic protein followed by down regulation of lysosomal enzyme (i.e. cathepsin) maturation as well as activity (Lee et al., 2010). The accumulations of lipid or ROS generation result in lysosome membrane damage and release lysosomal protease to the cytosol (Zdolsek et al., 1993). Abnormal lysosome permeabilization results in apoptosis or necrosis (Guicciardi et al., 2004). Altered lysosomal degradation induces massive accumulation of autolysosome and turn result in axonal transport impairment (Lee et al., 2011). Also, impairment of the nutrients (i.e. amino acid) recycle followed by delayed lysosomal proteolysis suppresses mTOR and keeps autophagy induction constitutive (Zoncu et al., 2011). Increases in lysosomal pH also decrease lysosomal calcium efflux, also increasing cytosolic calcium levels (Christensen et al., 2002).
Similar articles
- Lysosomal proteolysis and autophagy require presenilin 1 and are disrupted by Alzheimer-related PS1 mutations.
Lee JH, Yu WH, Kumar A, Lee S, Mohan PS, Peterhoff CM, Wolfe DM, Martinez-Vicente M, Massey AC, Sovak G, Uchiyama Y, Westaway D, Cuervo AM, Nixon RA. Lee JH, et al. Cell. 2010 Jun 25;141(7):1146-58. doi: 10.1016/j.cell.2010.05.008. Epub 2010 Jun 10. Cell. 2010. PMID: 20541250 Free PMC article. - Lysosome and calcium dysregulation in Alzheimer's disease: partners in crime.
McBrayer M, Nixon RA. McBrayer M, et al. Biochem Soc Trans. 2013 Dec;41(6):1495-502. doi: 10.1042/BST20130201. Biochem Soc Trans. 2013. PMID: 24256243 Free PMC article. Review. - Presenilin 1 Maintains Lysosomal Ca(2+) Homeostasis via TRPML1 by Regulating vATPase-Mediated Lysosome Acidification.
Lee JH, McBrayer MK, Wolfe DM, Haslett LJ, Kumar A, Sato Y, Lie PP, Mohan P, Coffey EE, Kompella U, Mitchell CH, Lloyd-Evans E, Nixon RA. Lee JH, et al. Cell Rep. 2015 Sep 1;12(9):1430-44. doi: 10.1016/j.celrep.2015.07.050. Epub 2015 Aug 20. Cell Rep. 2015. PMID: 26299959 Free PMC article. - Lysosomal alkalization and dysfunction in human fibroblasts with the Alzheimer's disease-linked presenilin 1 A246E mutation can be reversed with cAMP.
Coffey EE, Beckel JM, Laties AM, Mitchell CH. Coffey EE, et al. Neuroscience. 2014 Mar 28;263:111-24. doi: 10.1016/j.neuroscience.2014.01.001. Epub 2014 Jan 10. Neuroscience. 2014. PMID: 24418614 Free PMC article. - Autophagy failure in Alzheimer's disease--locating the primary defect.
Nixon RA, Yang DS. Nixon RA, et al. Neurobiol Dis. 2011 Jul;43(1):38-45. doi: 10.1016/j.nbd.2011.01.021. Epub 2011 Feb 3. Neurobiol Dis. 2011. PMID: 21296668 Free PMC article. Review.
Cited by
- Chronic cerebral hypoperfusion enhances Tau hyperphosphorylation and reduces autophagy in Alzheimer's disease mice.
Qiu L, Ng G, Tan EK, Liao P, Kandiah N, Zeng L. Qiu L, et al. Sci Rep. 2016 Apr 6;6:23964. doi: 10.1038/srep23964. Sci Rep. 2016. PMID: 27050297 Free PMC article. - Melatonin-mediated calcineurin inactivation attenuates amyloid beta-induced apoptosis.
Hong JM, Munna AN, Moon JH, Seol JW, Park SY. Hong JM, et al. IBRO Neurosci Rep. 2024 Feb 10;16:336-344. doi: 10.1016/j.ibneur.2024.02.001. eCollection 2024 Jun. IBRO Neurosci Rep. 2024. PMID: 38390232 Free PMC article. - Lipids as Emerging Biomarkers in Neurodegenerative Diseases.
Wei J, Wong LC, Boland S. Wei J, et al. Int J Mol Sci. 2023 Dec 21;25(1):131. doi: 10.3390/ijms25010131. Int J Mol Sci. 2023. PMID: 38203300 Free PMC article. Review. - Increased intracellular pH is necessary for adult epithelial and embryonic stem cell differentiation.
Ulmschneider B, Grillo-Hill BK, Benitez M, Azimova DR, Barber DL, Nystul TG. Ulmschneider B, et al. J Cell Biol. 2016 Nov 7;215(3):345-355. doi: 10.1083/jcb.201606042. J Cell Biol. 2016. PMID: 27821494 Free PMC article. - Amyloid β toxic conformer has dynamic localization in the human inferior parietal cortex in absence of amyloid plaques.
Kageyama Y, Saito A, Pletnikova O, Rudow GL, Irie Y, An Y, Murakami K, Irie K, Resnick SM, Fowler DR, Martin LJ, Troncoso JC. Kageyama Y, et al. Sci Rep. 2018 Nov 15;8(1):16895. doi: 10.1038/s41598-018-35004-3. Sci Rep. 2018. PMID: 30442978 Free PMC article.
References
Publication types
MeSH terms
Substances
LinkOut - more resources
Full Text Sources
Other Literature Sources
Medical
Molecular Biology Databases


