Matrix metalloproteinase-9 deficiency phenocopies features of preeclampsia and intrauterine growth restriction - PubMed (original) (raw)
Matrix metalloproteinase-9 deficiency phenocopies features of preeclampsia and intrauterine growth restriction
Vicki Plaks et al. Proc Natl Acad Sci U S A. 2013.
Abstract
The pregnancy complication preeclampsia (PE), which occurs in approximately 3% to 8% of human pregnancies, is characterized by placental pathologies that can lead to significant fetal and maternal morbidity and mortality. Currently, the only known cure is delivery of the placenta. As the etiology of PE remains unknown, it is vital to find models to study this common syndrome. Here we show that matrix metalloproteinase-9 (MMP9) deficiency causes physiological and placental abnormalities in mice, which mimic features of PE. As with the severe cases of this syndrome, which commence early in gestation, MMP9-null mouse embryos exhibit deficiencies in trophoblast differentiation and invasion shortly after implantation, along with intrauterine growth restriction or embryonic death. Reciprocal embryo transfer experiments demonstrated that embryonic MMP9 is a major contributor to normal implantation, but maternal MMP9 also plays a role in embryonic trophoblast development. Pregnant MMP9-null mice bearing null embryos exhibited clinical features of PE as VEGF dysregulation and proteinuria accompanied by preexisting elevated blood pressure and kidney pathology. Thus, our data show that fetal and maternal MMP9 play a role in the development of PE and establish the MMP9-null mice as a much-needed model to study the clinical course of this syndrome.
Keywords: ectoplacental cone; fetus.
Conflict of interest statement
The authors declare no conflict of interest.
Figures
Fig. 1.
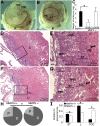
Placental abnormalities in E10.5 MMP9-null placentas. Animals were mated for 2 h/d to synchronize embryonic development. Representative E10.5 embryos from MMP9 WT × WT (+/+) (A) and from null × null (−/−) (B) matings, inside the yolk sac and resting on top of the placenta. The embryos are depicted with a black line. (C) A total of 18.4% of the embryos from −/− matings were runted compared with embryos from +/+ matings at E10.5 (n = 6 null and n = 4 WT pregnant mice). (D and F) Placental transverse midsections of WT and runted null E10.5 embryos, respectively. Box demarcates the enlarged area seen in E and G, respectively. D, decidua; FBS, fetal blood sinus; HD, head; L, labyrinth; MBS, maternal blood sinus; P, placenta; YS, yolk sac. Arrows indicate multiple layers of TGCs in runted −/− vs. single normal layer in +/+ placentas. (H) Pie charts of placenta (labyrinth, STs, TGCs) vs. decidua lengths calculated from the total length of implantation chambers of each genotype. The −/− placentas were 20% of the entire length of the implantation chamber vs. 27% in +/+ (*P = 0.002, n = 6 placentas per genotype). (I) Length of labyrinth and ST layers relative to total placental length of each genotype was significantly decreased in −/− placentas; the opposite was for TGC (*P < 0.02).
Fig. 2.
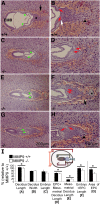
MMP9-null pregnancies exhibit impaired embryonic development and maternal-to-fetal connections as early as E7.5. Midtransverse sections through E7.5 WT × WT (+/+) and null × null (−/−) implantation sites were stained with H&E. (A) WT embryo with EPC (star), the network of blood channels forming between embryonic trophoblasts and maternal blood sinuses shown (black arrow). (B) Enlargement of the EPC area from A. The black arrowhead points to mature trophoblasts and the white arrow indicates the trophoblast stem cell layers at the base of the EPC. (C, E, and G) Embryos from MMP9 −/− implantation sites at E7.5. (D, F, and H). Enlargements of EPCs from embryos in C, E, and G, respectively. The embryo in C and D shows the twisted alignment of the EPC and embryo within the implantation site but near-normal development of the blood channels around the cone. The embryo in E and F exhibits normal alignment but an EPC area with few mature cells forming blood channels (black arrow). The asterisk indicates a debris plug that may block the formation of trophoblast to maternal blood sinus connections. The embryo in G and H shows the null phenotype with respect to EPC development. (H) Arrowhead shows more mature trophoblasts in the EPC, but a poorly developed network of blood channels. In all null embryos, the visceral endoderm and Reichert membrane plus PED were abnormal (red arrows show tips of visceral endoderm and green arrowheads show tips of Reichert membrane and PED). (I) Morphometric analysis of E7.5 embryos, deciduas, and EPCs. Cartoon indicates the parameters measured (n = 10 embryos each for −/− and +/+; *P < 0.007). Percentages are relative to +/+ embryo plus EPC (F) length for all and relative to +/+ area for EPC area (G).
Fig. 3.
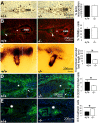
MMP9-null conceptuses exhibit changes in the vascular bed length and delayed differentiation but no significant perturbations in trophoblast proliferation and apoptosis. (A) BrdU staining (brown) postincorporation into WT × WT (+/+) and null × null (−/−) implantation sites determined at E6.5. EPCs are marked by stars. EMB, embryo. (B) TUNEL staining (green) of E7.5 +/+ and −/− implantation sites. Nuclei are stained with propidium iodide (red). EPCs marked by stars (n = 10 EPCs for each genotype). (C) The trophoblast vascular bed (length of vascular invasion) of null embryos was quantified from the whole mounts, with blood as a measure for functional vessels. The white line depicts the parameter measured. (D and E) Immunostainings of E7.5 implantation sites are visualized with FITC (green) and nuclei are counterstained with DAPI [blue; n = 5 for each genotype (−/−, +/+)]. (D) CD31/PECAM-1 immunostaining. Star indicates area enlarged (Insets) to show difference in cell morphology (*P < 0.005). (E) E-cadherin immunostaining. Asterisk indicates the area of the cone nearest the embryo where E-cadherin–positive cells are located (*P < 0.005).
Fig. 4.
Maternal MMP9 contributes to the establishment of the maternal-to-fetal connections. (A) Pregnancy rates (Left, X-marked columns; percentage of pregnant females among total females transferred with embryos) and implantation rates (Right; percentage of implantation sites detected among total embryos transferred) of null embryos transferred into WT or null females exhibit lower values than WT embryos (*P < 0.0001). (B) Implantation sites from embryos transfers between WT and null females exhibit multiple abnormalities including shallow trophoblast invasion resulting in blood pools around the EPCs and embryos, debris plugs resulting in abnormal embryos, and resorptions. (*Twisted, contorted, and constrained.) (C) Histological sections exemplify the defects of WT and null embryo transfers into females of the reciprocal genotype, with a severe phenotype in null embryos, exhibiting shallow invasion of immature-appearing trophoblasts. Number of EPCs and embryos analyzed by histology: WT into WT, n = 15/45; WT into null, n = 5/63; null into WT, n = 24/33; null into null, n = 15/33.
Fig. 5.
Pregnant MMP9-null mice exhibit clinical diagnostic features of PE. Cytokeratin staining of TGCs (arrows) from E20.5 placentas in control (+/−) and MMP9-null (−/−) mice on (A) the inner border of the ST layer (labyrinth border) or (B) the outer border of the ST layer (decidual border). Number of TGCs found in the placentas of the impaired −/− fetuses at (C) the labyrinth border or (D) the decidual border was significantly reduced (*P = 0.04 and P = 0.02, respectively). L, placental labyrinth. [*Aborted, dead after Caesarean (C) section.] (E) Total VEGF165 levels in sera collected from pregnant mice were significantly reduced in −/− at E12.5 and returned to control levels at P10. (F) Urine protein/creatinine level ratio (U-P/U-Cr) was significantly elevated in −/− at E13.5 and E18.5 but back to control levels by P10. (G) BP measurements reveal that −/− mice exhibit elevated BP during the pregnancy time period associated with lack of pups (C-sectioned on E18.5); pre-, before implantation until E4.5; early-, E4.5 to E7.5; mid-, E12.5 to E15.5; late-, E17.5 to E18.5. MMP9+/− and MMP9−/− are pregnant females that had pups on E18.5 [n = 7 MMP9+/− (7.2 pups plus 0.3 resorptions per female), n = 2 MMP9−/− (five pups plus one resorption per female), and n = 9 MMP9−/− plugged, no pups]. (H) Percentage of open glomerular capillaries in kidneys of females in G was significantly reduced, especially in the −/− plugged, no pups mice but also in −/− that had pups (*P < 0.0001). Representative H&E glomeruli images are included (lower-magnification images in
Fig. S3_C_
).
Similar articles
- Defective trophoblast invasion underlies fetal growth restriction and preeclampsia-like symptoms in the stroke-prone spontaneously hypertensive rat.
Barrientos G, Pussetto M, Rose M, Staff AC, Blois SM, Toblli JE. Barrientos G, et al. Mol Hum Reprod. 2017 Jul 1;23(7):509-519. doi: 10.1093/molehr/gax024. Mol Hum Reprod. 2017. PMID: 28402512 - PAPP-A2 deficiency does not exacerbate the phenotype of a mouse model of intrauterine growth restriction.
Christians JK, Lennie KI, Huicochea Munoz MF, Binning N. Christians JK, et al. Reprod Biol Endocrinol. 2018 Jun 12;16(1):58. doi: 10.1186/s12958-018-0376-4. Reprod Biol Endocrinol. 2018. PMID: 29895300 Free PMC article. - AMPK and Placental Progenitor Cells.
Kaufman MR, Brown TL. Kaufman MR, et al. Exp Suppl. 2016;107:73-79. doi: 10.1007/978-3-319-43589-3_4. Exp Suppl. 2016. PMID: 27812977 Review. - Trophoblast-Specific Expression of Hif-1α Results in Preeclampsia-Like Symptoms and Fetal Growth Restriction.
Albers RE, Kaufman MR, Natale BV, Keoni C, Kulkarni-Datar K, Min S, Williams CR, Natale DRC, Brown TL. Albers RE, et al. Sci Rep. 2019 Feb 26;9(1):2742. doi: 10.1038/s41598-019-39426-5. Sci Rep. 2019. PMID: 30808910 Free PMC article. - Endovascular trophoblast invasion: implications for the pathogenesis of intrauterine growth retardation and preeclampsia.
Kaufmann P, Black S, Huppertz B. Kaufmann P, et al. Biol Reprod. 2003 Jul;69(1):1-7. doi: 10.1095/biolreprod.102.014977. Epub 2003 Mar 5. Biol Reprod. 2003. PMID: 12620937 Review.
Cited by
- NR2F1 overexpression alleviates trophoblast cell dysfunction by inhibiting GDF15/MAPK axis in preeclampsia.
Zhang K, Zhang H, Wang B, Gao S, Sun C, Jia C, Cui J. Zhang K, et al. Hum Cell. 2024 Sep;37(5):1405-1420. doi: 10.1007/s13577-024-01095-6. Epub 2024 Jul 15. Hum Cell. 2024. PMID: 39007956 - Molecular determinants of microvascular dysfunction in hypertensive pregnancy and preeclampsia.
Yu W, Gao W, Rong D, Wu Z, Khalil RA. Yu W, et al. Microcirculation. 2018 Oct 19:e12508. doi: 10.1111/micc.12508. Online ahead of print. Microcirculation. 2018. PMID: 30338879 Free PMC article. - Monocytes and macrophages in pregnancy: The good, the bad, and the ugly.
True H, Blanton M, Sureshchandra S, Messaoudi I. True H, et al. Immunol Rev. 2022 Jul;308(1):77-92. doi: 10.1111/imr.13080. Epub 2022 Apr 21. Immunol Rev. 2022. PMID: 35451089 Free PMC article. Review. - Identifying novel regulators of placental development using time-series transcriptome data.
Vu HT, Kaur H, Kies KR, Starks RR, Tuteja G. Vu HT, et al. Life Sci Alliance. 2022 Dec 13;6(2):e202201788. doi: 10.26508/lsa.202201788. Print 2023 Feb. Life Sci Alliance. 2022. PMID: 36622342 Free PMC article. - Insights into the immunomodulatory regulation of matrix metalloproteinase at the maternal-fetal interface during early pregnancy and pregnancy-related diseases.
Jing M, Chen X, Qiu H, He W, Zhou Y, Li D, Wang D, Jiao Y, Liu A. Jing M, et al. Front Immunol. 2023 Jan 9;13:1067661. doi: 10.3389/fimmu.2022.1067661. eCollection 2022. Front Immunol. 2023. PMID: 36700222 Free PMC article. Review.
References
- McMaster MT, Zhou Y, Fisher SJ. Abnormal placentation and the syndrome of preeclampsia. Semin Nephrol. 2004;24(6):540–547. - PubMed
- Naicker T, Khedun SM, Moodley J, Pijnenborg R. Quantitative analysis of trophoblast invasion in preeclampsia. Acta Obstet Gynecol Scand. 2003;82(8):722–729. - PubMed
- Sibai B, Dekker G, Kupferminc M. Pre-eclampsia. Lancet. 2005;365(9461):785–799. - PubMed
Publication types
MeSH terms
Substances
Grants and funding
- DK55001/DK/NIDDK NIH HHS/United States
- CA075072/CA/NCI NIH HHS/United States
- CA151925/CA/NCI NIH HHS/United States
- CA155370/CA/NCI NIH HHS/United States
- R01 CA125550/CA/NCI NIH HHS/United States
- R01 CA155370/CA/NCI NIH HHS/United States
- CA057621/CA/NCI NIH HHS/United States
- DK081976/DK/NIDDK NIH HHS/United States
- U01 CA151925/CA/NCI NIH HHS/United States
- CA125550/CA/NCI NIH HHS/United States
- R01 DK055001/DK/NIDDK NIH HHS/United States
- HD026732/HD/NICHD NIH HHS/United States
- R01 CA057621/CA/NCI NIH HHS/United States
LinkOut - more resources
Full Text Sources
Other Literature Sources
Molecular Biology Databases
Research Materials
Miscellaneous


