Toward 'omic scale metabolite profiling: a dual separation-mass spectrometry approach for coverage of lipid and central carbon metabolism - PubMed (original) (raw)
. 2013 Jul 16;85(14):6876-84.
doi: 10.1021/ac401140h. Epub 2013 Jul 3.
Affiliations
- PMID: 23781873
- PMCID: PMC3761963
- DOI: 10.1021/ac401140h
Toward 'omic scale metabolite profiling: a dual separation-mass spectrometry approach for coverage of lipid and central carbon metabolism
Julijana Ivanisevic et al. Anal Chem. 2013.
Abstract
Although the objective of any 'omic science is broad measurement of its constituents, such coverage has been challenging in metabolomics because the metabolome is comprised of a chemically diverse set of small molecules with variable physical properties. While extensive studies have been performed to identify metabolite isolation and separation methods, these strategies introduce bias toward lipophilic or water-soluble metabolites depending on whether reversed-phase (RP) or hydrophilic interaction liquid chromatography (HILIC) is used, respectively. Here we extend our consideration of metabolome isolation and separation procedures to integrate RPLC/MS and HILIC/MS profiling. An aminopropyl-based HILIC/MS method was optimized on the basis of mobile-phase additives and pH, followed by evaluation of reproducibility. When applied to the untargeted study of perturbed bacterial metabolomes, the HILIC method enabled the accurate assessment of key, dysregulated metabolites in central carbon pathways (e.g., amino acids, organic acids, phosphorylated sugars, energy currency metabolites), which could not be retained by RPLC. To demonstrate the value of the integrative approach, bacterial cells, human plasma, and cancer cells were analyzed by combined RPLC/HILIC separation coupled to ESI positive/negative MS detection. The combined approach resulted in the observation of metabolites associated with lipid and central carbon metabolism from a single biological extract, using 80% organic solvent (ACN:MeOH:H2O 2:2:1). It enabled the detection of more than 30,000 features from each sample type, with the highest number of uniquely detected features by RPLC in ESI positive mode and by HILIC in ESI negative mode. Therefore, we conclude that when time and sample are limited, the maximum amount of biological information related to lipid and central carbon metabolism can be acquired by combining RPLC ESI positive and HILIC ESI negative mode analysis.
Figures
Figure 1
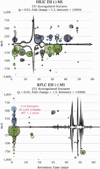
Cloud plots showing dysregulated metabolite features (represented by “bubbles”) in a bacterial response to nitric oxide treatment analyzed by HILIC/MS and RPLC/MS. The dysregulated features (up-regulated in blue, down-regulated in green) in comparison to “control” were filtered according to statistical thresholds shown in plots. The ion intensity was used as radius scale of each bubble.
Figure 2
Optimization of HILIC/MS analysis conditions. Each tested condition is presented by its overall score, calculated as a sum of normalized intensities of 50 metabolites from the hydrophilic standard mixture (Table S1, Table S3).
Figure 3
Reproducibility of optimized HILIC/MS and RPLC/MS in ESI negative mode. Curve plots represent the retention time deviation over a 60 minute run across 36 samples of Shewanella oneidensis extracts (“control” and “treated with nitric oxide”). Each sample is presented by a differentially colored curve. An overlay of total ion chromatograms (TICs) and one “zoomed in” example of an extracted ion chromatogram (EIC) are given below.
Figure 4
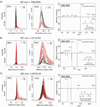
Extracted ion chromatograms (from RPLC/MS and HILIC/MS) and matching MS/MS spectra for three identified dysregulated metabolites in bacteria exposed to nitric oxide stress. Each metabolite dysregulation is defined by the peak area, fold change, and independent t-test p-value. A) RPLC: p = 6.6×10⁻¹¹, fold change = 2.9 vs. HILIC: p = 1.4×10⁻¹¹, fold change = 3, B) RPLC: p = 4.06×10⁻⁹, fold change = 8.8 vs. HILIC: p = 0.0008, fold change = 4.6 and C) RPLC: p = 0.005, fold change = 1.5 vs. HILIC: p = 0.5, fold change = 1.1, *Note that the metabolite shown in panel C has been putatively identified as ribose 5-phosphate or ribulose 5-phosphate.
Figure 5
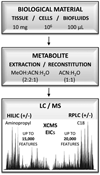
The integrated LC/MS workflow presenting the standard amount of material used, single extraction, and reconstitution protocol enabling comparative analysis by HILIC/MS and RPLC/MS in ESI positive and ESI negative ionization mode. The average number of features typically observed by each chromatographic / ionization mode is indicated as the number of EICs extracted by XCMS. Note that theoverall number of cells refers to human cells (~106). For significantly smaller size bacterial cells, the overall number was ~109 cells (10 mL of culture at OD~0.3).
Figure 6
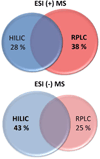
Metabolome coverage by HILIC and RPLC chromatographic mode in ESI positive and ESI negative mode (based on accurate mass only). Features uniquely identified by HILIC and by RPLC as well as the overlap were estimated as a percentage of the total number of metabolite features identified in ESI positive and in ESI negative mode, in three different types of samples (Table 1). The overlap between HILIC and RPLC is estimated at 34 ± 10 % and 32 ± 6 % in ESI positive mode and ESI negative mode, respectively.
Similar articles
- Two complementary reversed-phase separations for comprehensive coverage of the semipolar and nonpolar metabolome.
Naser FJ, Mahieu NG, Wang L, Spalding JL, Johnson SL, Patti GJ. Naser FJ, et al. Anal Bioanal Chem. 2018 Feb;410(4):1287-1297. doi: 10.1007/s00216-017-0768-x. Epub 2017 Dec 18. Anal Bioanal Chem. 2018. PMID: 29256075 Free PMC article. - HILIC-MS for metabolomics: An attractive and complementary approach to RPLC-MS.
Tang DQ, Zou L, Yin XX, Ong CN. Tang DQ, et al. Mass Spectrom Rev. 2016 Sep;35(5):574-600. doi: 10.1002/mas.21445. Epub 2014 Oct 3. Mass Spectrom Rev. 2016. PMID: 25284160 Review. - Hydrophilic interaction chromatography coupled to MS for metabonomic/metabolomic studies.
Spagou K, Tsoukali H, Raikos N, Gika H, Wilson ID, Theodoridis G. Spagou K, et al. J Sep Sci. 2010 Mar;33(6-7):716-27. doi: 10.1002/jssc.200900803. J Sep Sci. 2010. PMID: 20187037 Review.
Cited by
- A Protocol for Untargeted Metabolomic Analysis: From Sample Preparation to Data Processing.
Souza AL, Patti GJ. Souza AL, et al. Methods Mol Biol. 2021;2276:357-382. doi: 10.1007/978-1-0716-1266-8_27. Methods Mol Biol. 2021. PMID: 34060055 Free PMC article. - Determining conserved metabolic biomarkers from a million database queries.
Kurczy ME, Ivanisevic J, Johnson CH, Uritboonthai W, Hoang L, Fang M, Hicks M, Aldebot A, Rinehart D, Mellander LJ, Tautenhahn R, Patti GJ, Spilker ME, Benton HP, Siuzdak G. Kurczy ME, et al. Bioinformatics. 2015 Dec 1;31(23):3721-4. doi: 10.1093/bioinformatics/btv475. Epub 2015 Aug 13. Bioinformatics. 2015. PMID: 26275895 Free PMC article. - Cooking shapes the structure and function of the gut microbiome.
Carmody RN, Bisanz JE, Bowen BP, Maurice CF, Lyalina S, Louie KB, Treen D, Chadaideh KS, Maini Rekdal V, Bess EN, Spanogiannopoulos P, Ang QY, Bauer KC, Balon TW, Pollard KS, Northen TR, Turnbaugh PJ. Carmody RN, et al. Nat Microbiol. 2019 Dec;4(12):2052-2063. doi: 10.1038/s41564-019-0569-4. Epub 2019 Sep 30. Nat Microbiol. 2019. PMID: 31570867 Free PMC article. - Investigating the induction of polyphenol biosynthesis in the cultured Cycolocarya paliurus cells and the stimulatory mechanism of co-induction with 5-aminolevulinic acid and salicylic acid.
Ling LJ, Wang M, Pan CQ, Tang DB, Yuan E, Zhang YY, Chen JG, Peng DY, Yin ZP. Ling LJ, et al. Front Bioeng Biotechnol. 2023 Mar 9;11:1150842. doi: 10.3389/fbioe.2023.1150842. eCollection 2023. Front Bioeng Biotechnol. 2023. PMID: 36970633 Free PMC article. - CD147 a direct target of miR-146a supports energy metabolism and promotes tumor growth in ALK+ ALCL.
Montes-Mojarro IA, Steinhilber J, Griessinger CM, Rau A, Gersmann AK, Kohlhofer U, Fallier-Becker P, Liang HC, Hofmann U, Haag M, Klapper W, Schaeffeler E, Pichler BJ, Schwab M, Fend F, Bonzheim I, Quintanilla-Martinez L. Montes-Mojarro IA, et al. Leukemia. 2022 Aug;36(8):2050-2063. doi: 10.1038/s41375-022-01617-x. Epub 2022 Jun 8. Leukemia. 2022. PMID: 35676454 Free PMC article.
References
- Baker M. Nat. Methods. 2011;8:117–121. - PubMed
- Patti GJ. J. Sep. Sci. 2011;34:3460–9. - PubMed
- Bajad SU, Lu W, Kimball EH, Yuan J, Peterson C, Rabinowitz JD. J. of Chromatography A. 2006;1125:76–88. - PubMed
Publication types
MeSH terms
Substances
Grants and funding
- L30 AG0 038036/AG/NIA NIH HHS/United States
- RC1 HL101034/HL/NHLBI NIH HHS/United States
- P30 MH062261/MH/NIMH NIH HHS/United States
- T32 GM066698/GM/NIGMS NIH HHS/United States
- P01 DA026146/DA/NIDA NIH HHS/United States
- R01 ES022181/ES/NIEHS NIH HHS/United States
- L30 AG038036/AG/NIA NIH HHS/United States
- R01 CA170737/CA/NCI NIH HHS/United States
- R24 EY017540/EY/NEI NIH HHS/United States
LinkOut - more resources
Full Text Sources
Other Literature Sources


