Synaptic elimination and protection after minimal injury depend on cell type and their prelesion structural dynamics in the adult cerebral cortex - PubMed (original) (raw)
Synaptic elimination and protection after minimal injury depend on cell type and their prelesion structural dynamics in the adult cerebral cortex
A J Canty et al. J Neurosci. 2013.
Abstract
The axonal and synaptic mechanisms underlying dysfunction and repair of the injured CNS are poorly understood. Unresolved issues include to what degree, when, and how the surviving neurons degenerate and the extent of synaptic remodeling both along the severed axon and in the nearby area. One of the main reasons is the lack of tools to study the complex asynchronous and dynamic features of individual lesioned axon responses in the intact brain. To address these issues, we combined two-photon microscopy and laser microsurgery to image the real-time reorganization of cortical circuitry at synaptic resolution for periods of up to 1 year in the brain of living mice. Injured cortical axons were eliminated proximally through a two-phase retraction process, which continued for at least 3 months postlesion and was independent of the presence of scar tissue. Remarkably, axons which later attempt to regenerate in both the mature and juvenile brain retracted less, raising the possibility that targeting retraction may improve the chances of axon regrowth after axotomy. Comparing prelesion and postlesion dynamics on the same axons over several days and weeks revealed that, although synapse formation rates were unaffected, boutons on injured axons were either rapidly and persistently lost, or extremely resistant, depending on cell-type and their prelesion structural dynamics. Our data suggest a lasting deficiency in synaptic output on surviving injured cortical axons and a surprising difference in the vulnerability of synaptic boutons after axotomy, which depend on cell-type and their recent history.
Figures
Figure 1.
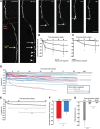
Laser mediated axotomy in the living mouse brain. A, Axons undergo stereotypical retraction from the lesion site, and swelling of the axon shaft in the surviving axon (proximal to cell body). Arrow indicates the lesion site. B, A binary mask (green) at a single focal plane showing only a small part of the selected axon (left) is used to target the high-energy laser to create an axonal lesion with characteristic fluorescent mark (arrow). C, Time course for repeated imaging prelesion and postlesion to enable analysis of synaptic dynamics. Dotted box highlights the 1 month time points considered. Scale bars: A, 10 μm; B, 5 μm.
Figure 2.
Stereotypical short-term changes following axonal lesion. A, Reconstruction of an axon targeted for lesion. The boxed area in red is shown in B. B, In vivo imaging of the axon in A showing short-term changes after axotomy including blebbing close to the lesion site (arrow), thinning of axon shaft, retraction of the cut axonal stump from the lesion site and eventual swelling of the axonal stump. p, Proximal; d, distal. Scale bar, 5 μm.
Figure 3.
Real-time monitoring of injured cortical axons reveals a link between retraction and regrowth. A, Axon retraction following laser microlesion. The distal portion of the axon, disconnected from the cell body (below lesion site), degenerates (arrowheads). Light blue arrows indicates the proximal stump, yellow arrow indicates lesion site. B, Regrowing axons retract significantly less than nonregrowing ones in the adult brain at 1, 4, and 8 d postlesion. Severed nonregrowing axons retract away from the lesion site with significant retraction in the following 8 d. C, Severed axons in juvenile animals showed less retraction after axotomy than the adult animals and a significant difference between regrowing and nonregrowing ones (for regrowing axons, n = 8, average retraction was 1.2 ± 1.2 μm at 1 d postlesion; 0.0 ± 0.0 μm at 4 d postlesion; 3.2 ± 2.4 μm at 8 d postlesion; for nonregrowing axons, n = 16, average retraction was 1.4 ± 1.4 μm at 1 d postlesion; 25.5 ± 15.2 μm at 4 d postlesion; 34.4 ± 31.4 μm at 8 d postlesion). D, Chronic imaging for up to one year postlesion shows the relative stability of the position of the axonal stump after the initial retraction until 8 d (n = 28) in both L6 (red, n = 9) and L2/3/5 and TCA (blue, n = 19) nonregrowing axons. E, Progressive retraction over 3 months for 10 nonregrowing axons. F, No difference in retraction between L6 and L2/3/5 and TCA axons. G, Retraction is more rapid in the first week compared with the following 3 months. Error bar represents the SEM. *p < 0.05, **p < 0.01 (Wilcoxon signed-rank test); n.s., nonsignificant. Scale bar, 20 μm.
Figure 4.
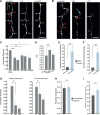
Rapid and persistent synaptic loss after axotomy on L6 axons. A, B, L6 axons demonstrate a rapid loss of TB synapses from as early as 6 h postlesion, which is maintained for at least 1 month. Synaptic loss is evident both further away from the lesion (A), and close to the lesion site (indicated by a circle in B); light blue arrow indicates axonal stump. C, When normalized to the average of pre lesion synaptic density, quantification of synaptic loss indicates a significant reduction in TB density along the surviving axon by 6 h (p = 0.004), which persists at 1 d (p = 0.002), 4 d (p = 0.007), and 1 month postlesion (p = 0.02). D, TB turnover (TOR) increased significantly (p = 0.007) in the first 4 d postlesion, and returned to baseline levels 4 d later. E, F, Further analysis indicated that the increased fraction (p = 0.004) and density (p = 0.003) of losses (pale blue) compared with synaptic gains (dark gray) was significant from 6 h postlesion. G, TB density significantly decreases both close (within 250 μm from the lesion site, day 0 = 0.99 ± 0.01, +6 h = 0.87 ± 0.04, +1 d = 0.85 ± 0.04; p = 0.02 between 0 and +6 h) and far from the lesion site (following 250 μm, day 0 = 0.99 ± 0.01, +6 h = 0.94 ± 0.02, +1 d = 0.91 ± 0.03; p = 0.03 between 0 and +6 h). Data normalized to prelesion density. H, TBs present for all the prelesion time points are not affected by the lesion. I, The fraction of TBs which were newly formed in the week before the lesion and then lost before the end of the imaging paradigm increases after the lesion. White arrows in A, B indicate stable synaptic boutons, red arrowheads indicate losses, and green arrowheads indicate gains. Error bar represents the SEM. *p < 0.05, **p < 0.01 (Wilcoxon signed-rank test); n.s., nonsignificant. Scale bars, 10 μm.
Figure 5.
Stability of L2/3/5 and TCA axonal boutons after axotomy. A, Representative example of in vivo time lapse imaging showing stable EPBs on L2/3/5 and TCA cells. B, D, Normalized synaptic density of EPBs does not significantly change at +1 d (p = 0.75), +4 d (p = 0.25), or +8 d (p = 0.57) postlesion. C, E, Similarly, there is no significant change in TOR of EPB synapses at either 1 or 4 d intervals postlesion. White arrows in A indicate stable synaptic boutons, red arrowheads indicate losses and green arrowheads indicate gains. n.s., nonsignificant. Scale bar, 10 μm (A).
Figure 6.
Absence of axon and synaptic reorganization in the surrounding neuropil. A, Individual axons were lesioned, often as close to few μm from nearby axons (inset) and the surrounding neuropil analyzed for up to 11 d postlesion. Pale gray arrows indicate intact axon before lesion, red arrowheads indicate the axonal stump, and blue arrowheads indicate previous trajectory of degenerated axonal segment. B, 10 and 30 μm analysis diameter bins (red circles) were created surrounding the lesion site. There was no significant difference in either total axonal length (C), data normalized to prelesion length, within 10, 30, and 100 μm or synaptic density (D), data normalized to prelesion density, detected in the surrounding circuitry after the lesion. n.s., Nonsignificant. Scale bars: A, 20 μm; B, 30 μm.
Similar articles
- In-vivo single neuron axotomy triggers axon regeneration to restore synaptic density in specific cortical circuits.
Canty AJ, Huang L, Jackson JS, Little GE, Knott G, Maco B, De Paola V. Canty AJ, et al. Nat Commun. 2013;4:2038. doi: 10.1038/ncomms3038. Nat Commun. 2013. PMID: 23799397 - Axotomy-dependent and -independent synapse elimination in organ cultures of Wld(s) mutant mouse skeletal muscle.
Parson SH, Ribchester RR, Davie N, Gandhi NP, Malik RQ, Gillingwater TH, Thomson D. Parson SH, et al. J Neurosci Res. 2004 Apr 1;76(1):64-75. doi: 10.1002/jnr.20016. J Neurosci Res. 2004. PMID: 15048930 - Increased axonal bouton dynamics in the aging mouse cortex.
Grillo FW, Song S, Teles-Grilo Ruivo LM, Huang L, Gao G, Knott GW, Maco B, Ferretti V, Thompson D, Little GE, De Paola V. Grillo FW, et al. Proc Natl Acad Sci U S A. 2013 Apr 16;110(16):E1514-23. doi: 10.1073/pnas.1218731110. Epub 2013 Mar 29. Proc Natl Acad Sci U S A. 2013. PMID: 23542382 Free PMC article. - Synaptic rearrangement following axonal injury: Old and new players.
Spejo AB, Oliveira AL. Spejo AB, et al. Neuropharmacology. 2015 Sep;96(Pt A):113-23. doi: 10.1016/j.neuropharm.2014.11.002. Epub 2014 Nov 13. Neuropharmacology. 2015. PMID: 25445484 Review. - Neuronal structural remodeling: is it all about access?
Chen JL, Nedivi E. Chen JL, et al. Curr Opin Neurobiol. 2010 Oct;20(5):557-62. doi: 10.1016/j.conb.2010.06.002. Curr Opin Neurobiol. 2010. PMID: 20621466 Free PMC article. Review.
Cited by
- Experimental Model Systems for Understanding Human Axonal Injury Responses.
Lee B, Cho Y. Lee B, et al. Int J Mol Sci. 2021 Jan 6;22(2):474. doi: 10.3390/ijms22020474. Int J Mol Sci. 2021. PMID: 33418850 Free PMC article. Review. - In vivo imaging of injured cortical axons reveals a rapid onset form of Wallerian degeneration.
Canty AJ, Jackson JS, Huang L, Trabalza A, Bass C, Little G, Tortora M, Khan S, De Paola V. Canty AJ, et al. BMC Biol. 2020 Nov 18;18(1):170. doi: 10.1186/s12915-020-00869-2. BMC Biol. 2020. PMID: 33208154 Free PMC article. - The synapse in traumatic brain injury.
Jamjoom AAB, Rhodes J, Andrews PJD, Grant SGN. Jamjoom AAB, et al. Brain. 2021 Feb 12;144(1):18-31. doi: 10.1093/brain/awaa321. Brain. 2021. PMID: 33186462 Free PMC article. Review. - In vivo imaging of neuronal calcium during electrode implantation: Spatial and temporal mapping of damage and recovery.
Eles JR, Vazquez AL, Kozai TDY, Cui XT. Eles JR, et al. Biomaterials. 2018 Aug;174:79-94. doi: 10.1016/j.biomaterials.2018.04.043. Epub 2018 May 7. Biomaterials. 2018. PMID: 29783119 Free PMC article. - In Vivo Imaging of CNS Injury and Disease.
Akassoglou K, Merlini M, Rafalski VA, Real R, Liang L, Jin Y, Dougherty SE, De Paola V, Linden DJ, Misgeld T, Zheng B. Akassoglou K, et al. J Neurosci. 2017 Nov 8;37(45):10808-10816. doi: 10.1523/JNEUROSCI.1826-17.2017. J Neurosci. 2017. PMID: 29118209 Free PMC article. Review.
References
- Canty AJ, Huang L, Jackson JS, Little GE, Knott GW, Maco B, De Paola V. In vivo single neuron axotomy triggers axon regeneration to restore synaptic density in specific cortical circuits. Nat Commun. 2013 in press. - PubMed
Publication types
MeSH terms
Substances
LinkOut - more resources
Full Text Sources
Other Literature Sources


