Stage-specific regulation of reprogramming to induced pluripotent stem cells by Wnt signaling and T cell factor proteins - PubMed (original) (raw)
Stage-specific regulation of reprogramming to induced pluripotent stem cells by Wnt signaling and T cell factor proteins
Ritchie Ho et al. Cell Rep. 2013.
Abstract
Wnt signaling is intrinsic to mouse embryonic stem cell self-renewal. Therefore, it is surprising that reprogramming of somatic cells to induced pluripotent stem cells (iPSCs) is not strongly enhanced by Wnt signaling. Here, we demonstrate that active Wnt signaling inhibits the early stage of reprogramming to iPSCs, whereas it is required and even stimulating during the late stage. Mechanistically, this biphasic effect of Wnt signaling is accompanied by a change in the requirement of all four of its transcriptional effectors: T cell factor 1 (Tcf1), Lef1, Tcf3, and Tcf4. For example, Tcf3 and Tcf4 are stimulatory early but inhibitory late in the reprogramming process. Accordingly, ectopic expression of Tcf3 early in reprogramming combined with its loss of function late enables efficient reprogramming in the absence of ectopic Sox2. Together, our data indicate that the stepwise process of reprogramming to iPSCs is critically dependent on the stage-specific control and action of all four Tcfs and Wnt signaling.
Copyright © 2013 The Authors. Published by Elsevier Inc. All rights reserved.
Figures
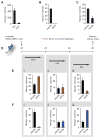
Figure 1. Biphasic role of Wnt signaling in reprogramming to iPSCs
(A) iOSCK MEFs were transduced with a Tomato (Ctrl) and _Dkk1_-encoding retrovirus, respectively, treated with dox to express the reprogramming factors, and Nanog positive colonies were quantified at day 13. (B) iOSCK MEFs were treated with dox and IWP2 or vehicle continuously throughout reprogramming, and Nanog positive colonies were counted at day nine. (C) As in (B), except that Wnt3a was added continuously throughout reprogramming. (D) Schematic of the reprogramming experiments to determine the effect of Wnt3a or IWP2 during different stages of reprogramming. (E) Nanog colony count for IWP2 treated reprogramming cultures as described in (D). (F) Nanog colony count for Wnt3a treated reprogramming cultures as described in (D). All reprogramming counts represent the average of two representative experiments and error bars depict standard deviation. See Figure S1 for additional information.
Figure 2. Tcf1 and Lef1 inhibit while Tcf3 and Tcf4 promote the early phase of reprogramming
(A) Schematic of the reprogramming experiment testing the requirement of Tcfs in the early phase of reprogramming. iOSCK MEFs were transfected with siRNAs targeting Tcfs individually or in combination, or with siCtrl twice, first 12 hours prior to the induction of OSCK factors and again together with dox addition. Knockdown was confirmed on day three of reprogramming, and Nanog positive colonies were counted at day 10 (Experiment 1) or day 9 (Experiment 2). (B) Nanog positive colony count from two independent experiments (Exp1 and Exp2), each with two technical replicates (A, B). (C) qPCR for Lef1, Tcf1, and Axin2 transcript levels relative to siCtrl upon Tcf3/Tcf4 double knockdown. Values represent the average of duplicate sampling, and error bars represent standard deviation. (D) As in (B), except that reprogramming cultures were treated with IWP2 or vehicle from day 0 to day 3 in addition to indicated siRNAs. Nanog positive colony count from two independent experiments (Exp1 and Exp2), each with two technical replicates (A, B) is given. (E) Number of Nanog positive colonies upon simultaneous knockdown of all four Tcfs. Knockdown was performed as part of experiment 1 shown in (B) and experimental conditions shared with (B) are indicated by asterisks. See Figure S2 for additional information.
Figure 3. Tcf3/Tcf4 depletion enhances the late phase of reprogramming in a Tcf1/Lef1 dependent manner
(A) Schematic of the reprogramming experiment testing the requirement of Tcfs in the late phase of reprogramming. iOSCK MEFs were transfected with siRNAs targeting Tcfs individually, or in combination, or with siCtrl once at day 6 post-induction of OSCK. Transcript levels and Nanog positive colonies were quantified on day 10 (Experiment 1) or day 9 (Experiment 2). (B) Nanog positive colony count from two independent experiments (Exp1 and Exp2), each with two technical replicates (A, B). (C) As in (B), except that the cultures were treated with IWP2 or vehicle from day 6 to day 9 in addition to indicated siRNAs. Nanog positive colony count from technical replicates of a representative experiment is given. See Figure S3 for additional information.
Figure 4. Ectopic expression of Tcf3 promotes early reprogramming events but inhibits the induction of pluripotency
(A) Experimental design for continuous Tcf3 overexpression from the pMX-retroviral vector during reprogramming of iOSCK MEFs carrying the Oct4-GFP transgene. Tomato expression served as control overexpression (Ctrl). (B) FACS analysis showing the percentage of SSEA1 positive cells at indicated times of a representative reprogramming experiment. (C) Nanog colony count representing the average of two independent experiments, each with two technical replicates, one counted on day 11 and one on day 15. Error bars indicate standard deviation of the averaged values. (D) Transcript levels of E-cadherin during reprogramming relative to MEFs. Values represent the average of duplicate sampling, and error bars represent standard deviation. (E) Staining for Alkaline phosphatase (AP) activity at day 10 of reprogramming. (F) Schematic of the Tcf3 domain structure and Tcf3 mutants used in this reprogramming experiment (i). Reprogramming was performed as in (A) with Tcf3 variants retrovirally expressed throughout reprogramming. AP colony count of a representative reprogramming experiment at day 11 is given (ii). See Figure S4 for additional information.
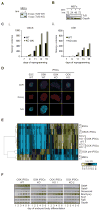
Figure 5. Tcf3 ablation allows reprogramming in the absence of Sox2
(A) PCR genotyping of Tcf32loxp/2loxp;Tg(UBC-Cre-ERT2) MEFs after treatment with 1μM tamoxifen (tam), or vehicle for 24 hours. Cells with homozygous 1loxp alleles are referred to as KO or Tcf3−/−, and cells with homozygous 2loxP alleles as wild-type (WT) or Tcf3+/+. (B) Western blot for Tcf3 on MEFs described in (A), 24–72 hours after tam addition. Gapdh served as a loading control. (C) Tcf32loxp/2loxp;Tg(UBC-Cre-ERT2) MEFs were transduced with separate retroviruses encoding OSCK (i) or OSK (ii), treated with and without tamoxifen, respectively, at day four to delete Tcf3. Nanog positive colonies were quantified at the indicated days of reprogramming by fixing parallel reprogramming wells and immunostaining for Nanog. (D) Immunostaining for Nanog and Tcf3 in iPSC lines isolated from OSK or OCK reprogramming cultures in which Tcf3 was deleted at day 4. DAPI staining marks nuclei. ESCs and OSK WT iPSCs serve as controls. (E) Hierarchical clustering of log2 expression ratios of indicated cell lines relative to the average intensity of each probe across all arrays. Only probes two-fold differentially expressed between ESCs and MEFs were included. (F) Tcf3 WT and Tcf3 KO OSK and OCK iPSC lines were differentiated by embryoid bodies. RNA was harvested at indicated time points and analyzed by semi-quantitative RT-PCR for expression of representative genes of each of the three embryonic germ layers. Gapdh serves as a loading control. See Figure S5 and Tables S1 and S2 for additional information.
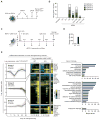
Figure 6. Regulation of OCK reprogramming by Tcf3
(A) Schematic of OCK pre-iPSC reprogramming experiments. Different siRNAs were transfected twice into wild-type OCK pre-iPSCs containing the _Nanog_-GFP reporter. Knockdown efficiency was assessed by qPCR three days after the initial transfection, and GFP positive colonies were quantified four days after the initial siRNA transfection. (B) _Nanog_-GFP positive colony count for a representative experiment with four technical replicates per condition is shown. (C) Schematic of the OCK reprogramming experiment used for gene expression analysis. Tcf32loxp/2loxp;Tg(UBC-Cre-ERT2) MEFs were infected retrovirally with OCK and split on day 3. Half of the culture was treated with tamoxifen (tam) at day four to generate the Tcf3 KO condition and the other half was exposed to vehicle control (WT). Both WT and KO reprogramming cultures were split again on day 21 to enhance the effect of Tcf3 deletion on the induction of pluripotency. RNA from KO and WT reprogramming cultures was harvested at indicated time points from parallel reprogramming wells and analyzed for gene expression. (D) Quantification of Nanog positive colonies at day 26 of the OCK reprogramming experiment described in (C). (E) Short Time-series Expression Miner (STEM) analysis for all transcripts that are at least two-fold differentially expressed between Tcf3 KO and WT OCK reprogramming cultures at any of the profiled time points during OCK reprogramming. The three top groups with significant patterns of co-regulated gene expression changes are shown and the number of probes and genes belonging to each group is indicated. Left: log2 expression ratio between Tcf3 KO and WT cultures for the probes in each group; middle: heat maps displaying the log2 expression ratios of probes belonging to these groups for both WT and KO reprogramming cultures, respectively, and of ESCs, all relative to MEFs; and right: significantly enriched GO terms for each group. Example genes from each group are also given. See Figure S6 and Tables S1, S3–S5 for additional information.
Figure 7. Step-wise modulation of Tcf3 levels enables efficient reprogramming in the absence of Sox2
(A) Scheme for the OCK reprogramming experiment with Tcf3 level modulation. MEFs carrying the M2rtTA and Oct4-GFP transgenes were infected with a dox-inducible retrovirus (pRetro) encoding Tcf3 and subsequently with constitutive retroviruses (pMX) encoding OCK. Dox was added during the first eight days of reprogramming at different concentrations, and subsequently Tcf3 was depleted by repeated siRNA transfection every three days beginning on day eight until day 29. _Oct4_-GFP positive colonies were quantified at indicated days. Hygromycin was added from d0–d8 of reprogramming to ensure that all cells carry the pRetro-Hygro-Tcf3 expressing vector. (B) Titration of Tcf3 transcript levels is achieved by varying dox concentrations in OCK reprogramming. Tcf3 transcript levels were measured in the reprogramming culture at day four and are presented relative to MEF levels. Note that 0.002 μg/ml dox induces ESC-like levels of Tcf3. Values represent the average of triplicate sampling, and error bars represent standard deviation. Expression of Tcf3 in virtually all cells was confirmed by immunostaining (data not shown). (C) Quantification of _Oct4_-GFP positive colonies at indicated days of reprogramming. Tcf3 was induced at different levels using different amounts of dox and siRNA was added as indicated. (D) Characterization of mice obtained upon blastocyst injection of OCK iPSC clones A and C, which were expanded from reprogramming cultures treated with 0.002μg/ml dox and subsequently depleted for Tcf3 as described in (C). Result of PCRs with primers specifically amplifying proviral integrations of pRetro-Tcf3 on genomic DNA extracted from liver, spleen, and tails are summarized. (E) Model summarizing the stage-specific roles of Tcfs and Wnt signaling in reprogramming to iPSCs, where the switch in Wnt response is associated with changing requirements for Tcfs, and two pairs of Tcf family members: Tcf1/Lef1 and Tcf3/Tcf4 have opposing functions early and late in reprogramming. See Figure S7 for additional information.
Similar articles
- Intrinsic properties of Tcf1 and Tcf4 splice variants determine cell-type-specific Wnt/β-catenin target gene expression.
Wallmen B, Schrempp M, Hecht A. Wallmen B, et al. Nucleic Acids Res. 2012 Oct;40(19):9455-69. doi: 10.1093/nar/gks690. Epub 2012 Aug 2. Nucleic Acids Res. 2012. PMID: 22859735 Free PMC article. - Temporal perturbation of the Wnt signaling pathway in the control of cell reprogramming is modulated by TCF1.
Aulicino F, Theka I, Ombrato L, Lluis F, Cosma MP. Aulicino F, et al. Stem Cell Reports. 2014 May 8;2(5):707-20. doi: 10.1016/j.stemcr.2014.04.001. eCollection 2014 May 6. Stem Cell Reports. 2014. PMID: 24936456 Free PMC article. - β-Catenin-independent activation of TCF1/LEF1 in human hematopoietic tumor cells through interaction with ATF2 transcription factors.
Grumolato L, Liu G, Haremaki T, Mungamuri SK, Mong P, Akiri G, Lopez-Bergami P, Arita A, Anouar Y, Mlodzik M, Ronai ZA, Brody J, Weinstein DC, Aaronson SA. Grumolato L, et al. PLoS Genet. 2013;9(8):e1003603. doi: 10.1371/journal.pgen.1003603. Epub 2013 Aug 15. PLoS Genet. 2013. PMID: 23966864 Free PMC article. - WNTing embryonic stem cells.
Wray J, Hartmann C. Wray J, et al. Trends Cell Biol. 2012 Mar;22(3):159-68. doi: 10.1016/j.tcb.2011.11.004. Epub 2011 Dec 22. Trends Cell Biol. 2012. PMID: 22196214 Review. - SOX2 and p53 Expression Control Converges in PI3K/AKT Signaling with Versatile Implications for Stemness and Cancer.
Schaefer T, Steiner R, Lengerke C. Schaefer T, et al. Int J Mol Sci. 2020 Jul 11;21(14):4902. doi: 10.3390/ijms21144902. Int J Mol Sci. 2020. PMID: 32664542 Free PMC article. Review.
Cited by
- Small molecules facilitate rapid and synchronous iPSC generation.
Bar-Nur O, Brumbaugh J, Verheul C, Apostolou E, Pruteanu-Malinici I, Walsh RM, Ramaswamy S, Hochedlinger K. Bar-Nur O, et al. Nat Methods. 2014 Nov;11(11):1170-6. doi: 10.1038/nmeth.3142. Epub 2014 Sep 24. Nat Methods. 2014. PMID: 25262205 Free PMC article. - Comparison of reprogramming genes in induced pluripotent stem cells and nuclear transfer cloned embryos.
Duan L, Wang Z, Shen J, Shan Z, Shen X, Wu Y, Sun R, Li T, Yuan R, Zhao Q, Bai G, Gu Y, Jin L, Lei L. Duan L, et al. Stem Cell Rev Rep. 2014 Aug;10(4):548-60. doi: 10.1007/s12015-014-9516-1. Stem Cell Rev Rep. 2014. PMID: 24828831 - A rare human syndrome provides genetic evidence that WNT signaling is required for reprogramming of fibroblasts to induced pluripotent stem cells.
Ross J, Busch J, Mintz E, Ng D, Stanley A, Brafman D, Sutton VR, Van den Veyver I, Willert K. Ross J, et al. Cell Rep. 2014 Dec 11;9(5):1770-1780. doi: 10.1016/j.celrep.2014.10.049. Epub 2014 Nov 20. Cell Rep. 2014. PMID: 25464842 Free PMC article. - Wnt some lose some: transcriptional governance of stem cells by Wnt/β-catenin signaling.
Lien WH, Fuchs E. Lien WH, et al. Genes Dev. 2014 Jul 15;28(14):1517-32. doi: 10.1101/gad.244772.114. Genes Dev. 2014. PMID: 25030692 Free PMC article. Review. - Depletion of Tcf3 and Lef1 maintains mouse embryonic stem cell self-renewal.
Ye S, Zhang T, Tong C, Zhou X, He K, Ban Q, Liu D, Ying QL. Ye S, et al. Biol Open. 2017 Apr 15;6(4):511-517. doi: 10.1242/bio.022426. Biol Open. 2017. PMID: 28288968 Free PMC article.
References
- Aubert J, Dunstan H, Chambers I, Smith A. Functional gene screening in embryonic stem cells implicates Wnt antagonism in neural differentiation. Nature biotechnology. 2002;20:1240–1245. - PubMed
- Biechele TL, Adams AM, Moon RT. Transcription-based reporters of Wnt/beta-catenin signaling. Cold Spring Harbor protocols. 2009;2009 pdb prot5223. - PubMed
- Clevers H, Nusse R. Wnt/beta-catenin signaling and disease. Cell. 2012;149:1192–1205. - PubMed
Publication types
MeSH terms
Substances
Grants and funding
- DP2OD001686/OD/NIH HHS/United States
- DP2 OD001686/OD/NIH HHS/United States
- P01 GM099134/GM/NIGMS NIH HHS/United States
- T32 AI060567/AI/NIAID NIH HHS/United States
- R01 CA128571/CA/NCI NIH HHS/United States
- R01-CA128571/CA/NCI NIH HHS/United States
- 5T32AI060567-07/AI/NIAID NIH HHS/United States
LinkOut - more resources
Full Text Sources
Other Literature Sources
Molecular Biology Databases


