Specialized sorting of GLUT4 and its recruitment to the cell surface are independently regulated by distinct Rabs - PubMed (original) (raw)
Specialized sorting of GLUT4 and its recruitment to the cell surface are independently regulated by distinct Rabs
L Amanda Sadacca et al. Mol Biol Cell. 2013 Aug.
Abstract
Adipocyte glucose uptake in response to insulin is essential for physiological glucose homeostasis: stimulation of adipocytes with insulin results in insertion of the glucose transporter GLUT4 into the plasma membrane and subsequent glucose uptake. Here we establish that RAB10 and RAB14 are key regulators of GLUT4 trafficking that function at independent, sequential steps of GLUT4 translocation. RAB14 functions upstream of RAB10 in the sorting of GLUT4 to the specialized transport vesicles that ferry GLUT4 to the plasma membrane. RAB10 and its GTPase-activating protein (GAP) AS160 comprise the principal signaling module downstream of insulin receptor activation that regulates the accumulation of GLUT4 transport vesicles at the plasma membrane. Although both RAB10 and RAB14 are regulated by the GAP activity of AS160 in vitro, only RAB10 is under the control of AS160 in vivo. Insulin regulation of the pool of RAB10 required for GLUT4 translocation occurs through regulation of AS160, since activation of RAB10 by DENND4C, its GTP exchange factor, does not require insulin stimulation.
Figures
FIGURE 1:
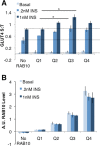
RAB10 overexpression increases GLUT4 translocation in single cells. (A) RAB10 KD cells electroporated with or without FLAG-RAB10 DNA were mixed and then plated for GLUT4 translocation assays. Cells were immunostained for FLAG expression to quantify RAB10 protein level, and data grouped accordingly. No RAB10, cells with FLAG staining below background. Within each experiment, S:T values for each cell were normalized to the mean S:T value for all cells in the 1 nM insulin condition. Mean normalized S:T values ± SEM, N = 3 independent assays. (B) RAB10 levels varied significantly between quartiles measured in A. Immunostaining for FLAG-RAB10 was quantified, and values for each cell were normalized to the average FLAG-RAB10 level measured in all cells quantified. Each quartile of RAB10 expression is significantly different from the quartile next to it; for example, Q4 has more RAB10 than Q3, and Q3 has more RAB10 than Q2. p > 0.05 in each case.
FIGURE 2:
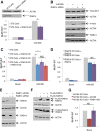
The AS160/RAB10 signaling module is a key regulator of GLUT4 translocation. (A) AS160 KD combined with RAB10 overexpression drives GLUT4 translocation without insulin. S:T values normalized to GLUT4 in 1 nM insulin–treated 3T3-L1 control cells determined in each individual experiment. Mean normalized S:T values ± SEM, N = 10 or 11 assays. (B) Western blot showing overexpression of RAB10 and knockdown of AS160 from cells assayed in A. (C) TR trafficking is not affected by RAB10 overexpression or AS160 knockdown. S:T values normalized to TR S:T in basal 3T3-L1 cells determined in each individual experiment. Mean normalized S:T values ± SEM, N = 3 assays. (D) DENND4C KD rescues the basal retention defect of AS160 KD cells to a similar extent as RAB10 KD. S:T values normalized to GLUT4 in basal AS160 KD cells determined in each individual experiment. Mean normalized S:T values ± SEM, N = 4–7 assays. Basal S:T, AS160 KD vs. AS160 KD + DENND4C KD, p = 0.011. *p < 0.05, two-tailed paired _t_ test, nonnormalized raw data. NS, not significant with _p_ > 0.05, two-tailed paired t test, nonnormalized raw data.
FIGURE 3:
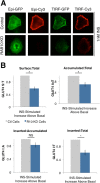
RAB10 regulates the accumulation/docking step of GLUT4 translocation. (A) TIRF microscopy was used to quantify total GLUT4 (Epi-GFP), surface GLUT4 (Epi-Cy3), GLUT4 accumulated in the TIRF zone (∼200 nm below the PM; TIRF-GFP), and GLUT4 inserted into the PM (TIRF-Cy3). Representative images of cells from the experiments in B. RAB10 KD cells with approximately equal amounts of total GLUT4 have less GLUT4 in the TIRF zone and on the cell surface after 1 nM insulin treatment. (B) Compared to control cells, RAB10 KD cells treated with 1 nM insulin have a lower proportion of total GLUT4 accumulated near the PM, resulting in a decreased proportion of GLUT4 on the surface/inserted into the PM. The proportion of total GLUT4 on the surface (Epi-Cy3/Epi-GLUT4; S:T, top left), the proportion of total GLUT4 accumulated near the PM (TIRF-GFP/Epi-GFP; Accumulated:Total, top left), the proportion of GLUT4 near the PM that is on the surface (TIRF-Cy3/TIRF-GFP, Inserted:Accumulated, bottom left), and the proportion of total GLUT4 inserted into the PM (TIRF-Cy3/Epi-GLUT4, Inserted:Total, bottom right) were calculated based on quantification of images such as those shown in A. Data are expressed as insulin-stimulated increase over basal conditions. RAB10 KD cell values are normalized to control cell values in each assay, mean ± SEM of N = 6 assays. *p < 0.05, two-tailed paired _t_ test, nonnormalized raw data. NS, not significant with _p_ > 0.05, two-tailed paired t test, nonnormalized raw data.
FIGURE 4:
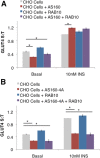
The AS160-RAB10 signaling module is partially sufficient for GLUT4 translocation. (A) Overexpression of FLAG-AS160 confers basal retention, and overexpression of pcDNA-RAB10 augments insulin-stimulated GLUT4 translocation in CHO cells. S:T values normalized to GLUT4 in insulin-stimulated CHO cells determined in each individual experiment. Mean normalized S:T values ± SEM, N = 4 assays. (B) Expression of constitutively active FLAG-AS160-4A in CHO cells confers basal retention but blocks insulin-stimulated GLUT4 translocation. S:T values normalized to GLUT4 in insulin-stimulated CHO cells determined in each individual experiment. Mean normalized S:T values ± SEM, N = 4–8 assays. *p < 0.05, one-tailed paired t test, nonnormalized raw data.
FIGURE 5:
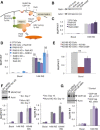
RalA, MUNC18C, and CDP138 are not involved in GLUT4 translocation. (A) Schematic of regulated GLUT4 translocation. GLUT4 traffics to the PM via two pathways: a constitutive pathway shared with TR with a relatively fast rate constant under basal conditions and a modest increase in rate upon insulin stimulation, as well as a specialized GSV pathway with a slow rate of GLUT4 exocytosis under basal conditions but a fast rate when stimulated with insulin. The TELEY motif on GLUT4 promotes sorting of GLUT4 into GSVs, whereas the FQQI motif governs sorting of GLUT4 between the endosome and a TGN retention compartment. (B) Representative Western blot showing RalA knockdown via two different siRNA sequences, si5 and si9, or both in combination. Quantification suggests ∼73, 77, or 84% knockdown, respectively. (C) RalA knockdown does not affect GLUT4 translocation under basal conditions or in cells stimulated with 1 nM insulin. Mean normalized S:T values ± SEM, N = 3–5 assays. (D) RalA knockdown has no effect on GLUT4 translocation in control or RAB10 KD cells or in RAB10 KD cells rescued with FLAG-RAB10. Mean normalized S:T values ± SEM, N = 3 assays. (E) RalA knockdown does not rescue the basal retention defect of AS160 KD cells. Mean normalized S:T values ± SEM, N = 3 assays. (F) MUNC18C KD has no effect on insulin-stimulated GLUT4 translocation. Inset, representative Western blot showing MUNC18C KD. Quantification suggests ∼52% knockdown. Left, GLUT4 translocation in control and MUNC18C knockdown on day 7 of differentiation. Mean normalized S:T values ± SEM, N = 2 or 3 assays. Right, GLUT4 translocation in control and MUNC18C knockdown on day 10 of differentiation. Mean normalized S:T values ± SEM, N = 5 assays; 100 nM insulin, MUNC18C KD vs. control, *p < 0.05; two-tailed paired t test, nonnormalized raw data. (G) CDP138 KD has no effect on insulin-stimulated GLUT4 translocation. Mean normalized S:T values ± SEM, N = 12 assays. Inset, representative Western blot showing CDP138 KD accomplished with both a mix of siRNAs or one siRNA from that mix (si1717). Quantification suggests ∼90% knockdown in both cases.
FIGURE 6:
RAB14 acts to regulate GLUT4 translocation via the GSV pathway at a step downstream of insulin signaling to AKT but upstream of AS160 regulation. (A) Top, representative Western blot showing knockdown of RAB14. Quantification suggests ∼95% knockdown. Bottom, RAB14 knockdown in 3T3-L1 cells blunts insulin-stimulated GLUT4 translocation. S:T values normalized to GLUT4 in 1 nM insulin–treated 3T3-L1 control cells determined in each individual experiment. Mean normalized S:T values ± SEM, N = 7 or 8 assays. (B) Representative Western blot showing normal AKT phosphorylation in response to 1 nM insulin treatment in 3T3-L1 adipocytes lacking RAB14. (C) RAB14 KD has no additive effect when combined with RAB10 KD. S:T values normalized to GLUT4 in 1 nM insulin–treated 3T3-L1 control cells determined in each individual experiment. Mean normalized S:T values ± SEM, N = 5 assays. (D) Overexpression of RAB14 in RAB10 KD cells does not rescue the GLUT4 translocation defect in RAB10 KD cells. S:T values normalized to GLUT4 in 1 nM insulin–treated RAB10 KD cells rescued with RAB10 reexpression determined in each individual experiment. Mean normalized S:T values ± SEM, N = 4 assays. (E) Representative Western blot showing expression of RAB10 and RAB14 in adipocytes electroporated with RAB10- and/or RAB14-directed siRNA sequences. Knockdown of one Rab protein does not result in a compensatory change in the expression of the other Rab. (F) Representative Western blot showing expression of RAB10 and RAB14 in adipocytes electroporated with DNA encoding FLAG-RAB10 or FLAG-RAB14. Overexpression of one Rab protein does not result in a compensatory change in the expression of the other Rab. (G) RAB14 KD does not rescue the basal retention defect of AS160 KD cells. Mean normalized S:T values ± SEM, N = 5 assays. S:T values normalized to GLUT4 in basal AS160 KD cells determined in each individual experiment. *p < 0.05, two-tailed paired t test, nonnormalized raw data.
FIGURE 7:
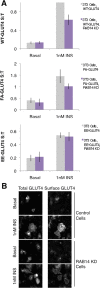
RAB14 controls a GLUT4 sorting step. (A) RAB14 KD blunts insulin-stimulated translocation of WT-GLUT4 and FA-GLUT4 but not EE-GLUT4. S:T values normalized to WT GLUT4 in 1 nM insulin–treated 3T3-L1 cells determined in each individual experiment. Mean normalized S:T values ± SEM, N = 3–5 assays. p < 0.05, two-tailed paired _t_ test, nonnormalized raw data. NS, not significant with _p_ > 0.05, two-tailed paired t test, nonnormalized raw data. (B) RAB14 KD does not induce a gross redistribution of GLUT4, as measured by epifluorescence microscopy. Images of total GLUT4 (HA-GLUT4-GFP intrinsic fluorescence, left) and surface GLUT4 (anti-HA immunostaining, right) of both basal and insulin-treated control and RAB14 KD cells.
Similar articles
- A Rab10:RalA G protein cascade regulates insulin-stimulated glucose uptake in adipocytes.
Karunanithi S, Xiong T, Uhm M, Leto D, Sun J, Chen XW, Saltiel AR. Karunanithi S, et al. Mol Biol Cell. 2014 Oct 1;25(19):3059-69. doi: 10.1091/mbc.E14-06-1060. Epub 2014 Aug 7. Mol Biol Cell. 2014. PMID: 25103239 Free PMC article. - Rab10, a target of the AS160 Rab GAP, is required for insulin-stimulated translocation of GLUT4 to the adipocyte plasma membrane.
Sano H, Eguez L, Teruel MN, Fukuda M, Chuang TD, Chavez JA, Lienhard GE, McGraw TE. Sano H, et al. Cell Metab. 2007 Apr;5(4):293-303. doi: 10.1016/j.cmet.2007.03.001. Cell Metab. 2007. PMID: 17403373 - Rab10 in insulin-stimulated GLUT4 translocation.
Sano H, Roach WG, Peck GR, Fukuda M, Lienhard GE. Sano H, et al. Biochem J. 2008 Apr 1;411(1):89-95. doi: 10.1042/BJ20071318. Biochem J. 2008. PMID: 18076383 - Signal transduction meets vesicle traffic: the software and hardware of GLUT4 translocation.
Klip A, Sun Y, Chiu TT, Foley KP. Klip A, et al. Am J Physiol Cell Physiol. 2014 May 15;306(10):C879-86. doi: 10.1152/ajpcell.00069.2014. Epub 2014 Mar 5. Am J Physiol Cell Physiol. 2014. PMID: 24598362 Review. - Glucose transporter 4: cycling, compartments and controversies.
Dugani CB, Klip A. Dugani CB, et al. EMBO Rep. 2005 Dec;6(12):1137-42. doi: 10.1038/sj.embor.7400584. EMBO Rep. 2005. PMID: 16319959 Free PMC article. Review.
Cited by
- Munc18c: a controversial regulator of peripheral insulin action.
Ramalingam L, Yoder SM, Oh E, Thurmond DC. Ramalingam L, et al. Trends Endocrinol Metab. 2014 Nov;25(11):601-8. doi: 10.1016/j.tem.2014.06.010. Epub 2014 Jul 12. Trends Endocrinol Metab. 2014. PMID: 25028245 Free PMC article. Review. - Proteomic Analysis of GLUT4 Storage Vesicles Reveals Tumor Suppressor Candidate 5 (TUSC5) as a Novel Regulator of Insulin Action in Adipocytes.
Fazakerley DJ, Naghiloo S, Chaudhuri R, Koumanov F, Burchfield JG, Thomas KC, Krycer JR, Prior MJ, Parker BL, Murrow BA, Stöckli J, Meoli CC, Holman GD, James DE. Fazakerley DJ, et al. J Biol Chem. 2015 Sep 25;290(39):23528-42. doi: 10.1074/jbc.M115.657361. Epub 2015 Aug 3. J Biol Chem. 2015. PMID: 26240143 Free PMC article. - GLUT4 translocation and dispersal operate in multiple cell types and are negatively correlated with cell size in adipocytes.
Koester AM, Geiser A, Bowman PRT, van de Linde S, Gadegaard N, Bryant NJ, Gould GW. Koester AM, et al. Sci Rep. 2022 Nov 29;12(1):20535. doi: 10.1038/s41598-022-24736-y. Sci Rep. 2022. PMID: 36446811 Free PMC article. - Regulation of in vivo dynein force production by CDK5 and 14-3-3ε and KIAA0528.
Chapman DE, Reddy BJN, Huy B, Bovyn MJ, Cruz SJS, Al-Shammari ZM, Han H, Wang W, Smith DS, Gross SP. Chapman DE, et al. Nat Commun. 2019 Jan 16;10(1):228. doi: 10.1038/s41467-018-08110-z. Nat Commun. 2019. PMID: 30651536 Free PMC article. - Spatiotemporal Regulators for Insulin-Stimulated GLUT4 Vesicle Exocytosis.
Zhou X, Shentu P, Xu Y. Zhou X, et al. J Diabetes Res. 2017;2017:1683678. doi: 10.1155/2017/1683678. Epub 2017 Apr 25. J Diabetes Res. 2017. PMID: 28529958 Free PMC article. Review.
References
- Abel ED, Peroni O, Kim JK, Kim YB, Boss O, Hadro E, Minnemann T, Shulman GI, Kahn BB. Adipose-selective targeting of the GLUT4 gene impairs insulin action in muscle and liver. Nature. 2001;409:729–733. - PubMed
- Bai L, Wang Y, Fan J, Chen Y, Ji W, Qu A, Xu P, James DE, Xu T. Dissecting multiple steps of GLUT4 trafficking and identifying the sites of insulin action. Cell Metabolism. 2007;5:47–57. - PubMed
Publication types
MeSH terms
Substances
Grants and funding
- F32 NRSA DK095532/DK/NIDDK NIH HHS/United States
- R01 DK052852/DK/NIDDK NIH HHS/United States
- F32 DK095532/DK/NIDDK NIH HHS/United States
- R01DK5285/DK/NIDDK NIH HHS/United States
- GM007739/GM/NIGMS NIH HHS/United States
- T32 GM007739/GM/NIGMS NIH HHS/United States
LinkOut - more resources
Full Text Sources
Other Literature Sources
Medical
Miscellaneous
