Ultrahigh-resolution imaging reveals formation of neuronal SNARE/Munc18 complexes in situ - PubMed (original) (raw)
Ultrahigh-resolution imaging reveals formation of neuronal SNARE/Munc18 complexes in situ
Alexandros Pertsinidis et al. Proc Natl Acad Sci U S A. 2013.
Abstract
Membrane fusion is mediated by complexes formed by SNAP-receptor (SNARE) and Secretory 1 (Sec1)/mammalian uncoordinated-18 (Munc18)-like (SM) proteins, but it is unclear when and how these complexes assemble. Here we describe an improved two-color fluorescence nanoscopy technique that can achieve effective resolutions of up to 7.5-nm full width at half maximum (3.2-nm localization precision), limited only by stochastic photon emission from single molecules. We use this technique to dissect the spatial relationships between the neuronal SM protein Munc18-1 and SNARE proteins syntaxin-1 and SNAP-25 (25 kDa synaptosome-associated protein). Strikingly, we observed nanoscale clusters consisting of syntaxin-1 and SNAP-25 that contained associated Munc18-1. Rescue experiments with syntaxin-1 mutants revealed that Munc18-1 recruitment to the plasma membrane depends on the Munc18-1 binding to the N-terminal peptide of syntaxin-1. Our results suggest that in a primary neuron, SNARE/SM protein complexes containing syntaxin-1, SNAP-25, and Munc18-1 are preassembled in microdomains on the presynaptic plasma membrane. Our superresolution imaging method provides a framework for investigating interactions between the synaptic vesicle fusion machinery and other subcellular systems in situ.
Keywords: active stabilization; colocalization; exocytosis; neurotransmission; single-molecule.
Conflict of interest statement
The authors declare no conflict of interest.
Figures
Fig. 1.
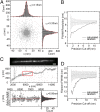
Superresolution imaging of point-like (20 bp dsDNA) and one-dimensional (actin filaments) objects. (A) xy clusters of localization points for individual Cy5 molecules attached to the surface-tethered DNA. The clusters for each dye molecule were aligned by their respective center of mass and superimposed. Lorentzian fits through the distributions show 2√2_σ_0 = 8.8 nm and 9.3 nm FWHM resolution in x and y, respectively. (B) Refinement of the xy distribution by selecting progressively better-localized molecules increases the effective resolution down to ≤d = 2.35_s_ ∼ 7.5-nm FWHM (s ∼ 3.2 nm). Selecting random subsets of the localization points does not result in increased resolution (gray curve). (C) (Top) Diffraction-limited image of an Alexa 647-phalloidin decorated filament. (Scale bar: 1 μm.) (Middle) Localization points (centers of observed spots) for the filament in Top (note different scales in x and y). (Bottom) Close-up of red rectangle in Top. The red line is a fifth-order polynomial fit. (D) Refinement of xy distributions by keeping progressively better-localized dye molecules decreases the measured filament width down to d = 2.35_s_ ∼ 11-nm FWHM (s ∼ 4.5 nm).
Fig. 2.
Superresolution imaging of SNAP-25 organization along neuronal axons. (A) Localization points of Alexa 647-labeled SNAP-25 antibodies. We imaged a thin region of the culture, slightly above the coverslip, to minimize spurious signal from antibodies nonspecifically bound to the glass as well as out-of-focus fluorescence background. The diffraction-limited summed-TIR reconstruction (Inset) discerns individual ∼300-nm-diameter axons, but fails to reveal the high-resolution information present in the xy localization data. (Scale-bar: 3 μm.) (B) Effective superresolved Point Spread Function (PSF), determined by aligning the localization clusters from n = 439 individual (well-resolved, in dilute staining conditions) SNAP-25 antibodies, showing 2√2_σ_0 =13-nm FWHM resolution. (C) Molecular probability density surface ρ(x, y) determined from the localization data in the region enclosed by the red square in A. Distinct clusters of localization points (black dots) corresponding to individual SNAP-25 antibodies can be resolved to d ∼ 13-nm FWHM resolution (
Fig. S4
). The red circles indicate the estimated locations of individual SNAP-25 antibodies (Methods), which are not distributed uniformly along the axons. Instead, individual antibodies are spaced in close proximity, consistent with the organization of multiple SNAP-25 molecules in 50- to 100-nm nanodomains.
Fig. 3.
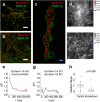
Colocalization of SNAP-25, syntaxin-1, and Munc18-1 in clusters. (A) Overlaid confocal images of syntaxin-1 (red) and SNAP-25 (green) show almost complete overlap. (B) _xy_-scatter plots of the syntaxin-1 (red dots) and SNAP-25 (green dots) superresolution localizations. (C and D) The localizations of syntaxin-1 and SNAP-25 are correlated at nanometer scales, shown by the cross-correlation map g(x, y) (C) and the radial pair distribution function g(r) (D). The red line is an exponential fit with ξ = 98 nm. (E) Overlaid confocal images of Munc18-1 (red) and SNAP-25 (green) show almost complete overlap. (F) _xy_-scatter plots of the Munc18-1 (red dots) and SNAP-25 (green dots) superresolution localizations. (G and H) The localizations of Munc18-1 and SNAP-25 are correlated at nanometer scales, shown by the cross-correlation map g(x, y) (G) and the radial pair distribution function g(r) (H). The red line is an exponential fit with ξ = 87 nm. [Scale bars: 32 μm (A and E), 1 μm (B and F), and 100 nm (C and G and Insets in B and F).]
Fig. 4.
Loss of Munc18-1–SNAP-25 colocalization upon deletion of both syntaxin-1 isoforms. (A and B) Overlaid confocal images of Munc18-1 (red) and SNAP-25 (green) from syntaxin-1A-null neurons infected with control (A) and syntaxin-1B shRNA (B) viruses. Significant Munc18–SNAP-25 overlap remains in the control (A) but is lost upon syntaxin-1B knockdown (B). (C) _xy_-scatter plots of the Munc18-1 (red dots) and SNAP-25 (green dots) superresolution localizations show that upon deletion of both syntaxin-1 isoforms, SNAP-25 remains localized on the membrane whereas Munc18-1 is mostly distributed in the cytoplasm. The Munc18-1–SNAP-25 correlation persists in the syntaxin-1A-null neurons (D and E; control shRNA), but is lost upon additional knockdown of syntaxin-1B (F and G), as shown in the cross-correlation maps g(x, y) (D and F) and the radial pair distribution functions g(r) (E and G). The red line is an exponential fit with ξ = 99 nm. (H) Relative Munc18-1–SNAP-25 correlation amplitude g(r = 0) for measurements from syntaxin-1A-null neurons obtained from n = 2 independent mouse litters (n = 19 and n = 18 regions of interest for control and knockdown, respectively). Boxes, SE; whiskers, 10th–90th percentile; crosses, min–max. The correlation is significantly reduced upon additional syntaxin-1B knockdown (P = 0.006, one-way ANOVA). [Scale bars: 32 μm (A and B), 1 μm (C), and 100 nm (D and F).]
Fig. 5.
Rescue of Munc18-1–SNAP-25 cross-correlation by syntaxin-1A overexpression. (A) _xy_-scatter plots of superresolution localization of Munc18-1 (red) and SNAP-25 (green) in syntaxin-1A-null neurons that were infected with a virus encoding shRNA for mouse syntaxin-1 and overexpressing a rat syntaxin-1A. Overexpression of rat syntaxin-1A rescues the Munc18-1–SNAP-25 cross-correlation at nanometer scales, as shown in the cross-correlation map g(x, y) (B) and pair-distribution function g(r) (C). The red line is an exponential fit with ξ = 56 nm. (D) The syntaxin-1 N-peptide is important for recovering Munc18-1–SNAP-25 cross-correlation. Shown is the relative Munc18-1–SNAP-25 correlation amplitude g(r = 0) for measurements from syntaxin-1A-null neurons obtained from n = 2 independent mouse litters (n = 28, 14, 18, and 21 regions of interest for N-terminal deletion rescue, wild-type rescue, LE rescue, and knockdown respectively). Boxes, SE; whiskers, 10th–90th percentile; crosses, min–max. The correlation is significantly higher for WT rescue compared with the knockdown and the NTD rescue and for LE rescue compared with the knockdown (P = 0.018, P = 0.044, and P = 0.022, respectively, one-way ANOVA). [Scale bars: 1 μm (A) and 100 nm (B).] (E) A dynamic equilibrium model for Munc18-1, SNAP-25, and syntaxin-1 associations on the plasma membrane. Wild-type syntaxin-1 (yellow) can interconvert between (Top Left) an open conformation that can associate with SNAP-25 (green) and can bind Munc18-1 (gray) in an N-peptide-dependent interaction and (Top Right) a closed conformation that displaces SNAP-25 and binds tightly to Munc18-1. Our results indicate that the closed-syntaxin-1/Munc18-1 complex is not the only major configuration outside the sites of fusion but rather that the N-peptide-dependent tripartite open-syntaxin-1/SNAP-25/Munc18-1 state is significantly populated. After Munc18-1 recruitment, a fusion-competent complex can be formed with the addition of synaptobrevin-2 (red). Munc18-1 can participate in fusion pore opening by interacting with the ternary SNARE complex.
Similar articles
- Dual modes of Munc18-1/SNARE interactions are coupled by functionally critical binding to syntaxin-1 N terminus.
Khvotchev M, Dulubova I, Sun J, Dai H, Rizo J, Südhof TC. Khvotchev M, et al. J Neurosci. 2007 Nov 7;27(45):12147-55. doi: 10.1523/JNEUROSCI.3655-07.2007. J Neurosci. 2007. PMID: 17989281 Free PMC article. - Syntaxin N-terminal peptide motif is an initiation factor for the assembly of the SNARE-Sec1/Munc18 membrane fusion complex.
Rathore SS, Bend EG, Yu H, Hammarlund M, Jorgensen EM, Shen J. Rathore SS, et al. Proc Natl Acad Sci U S A. 2010 Dec 28;107(52):22399-406. doi: 10.1073/pnas.1012997108. Epub 2010 Dec 7. Proc Natl Acad Sci U S A. 2010. PMID: 21139055 Free PMC article. - Tomosyn guides SNARE complex formation in coordination with Munc18 and Munc13.
Li Y, Wang S, Li T, Zhu L, Ma C. Li Y, et al. FEBS Lett. 2018 Apr;592(7):1161-1172. doi: 10.1002/1873-3468.13018. Epub 2018 Mar 13. FEBS Lett. 2018. PMID: 29485200 - Energetics, kinetics, and pathways of SNARE assembly in membrane fusion.
Zhang Y, Ma L, Bao H. Zhang Y, et al. Crit Rev Biochem Mol Biol. 2022 Aug;57(4):443-460. doi: 10.1080/10409238.2022.2121804. Epub 2022 Sep 24. Crit Rev Biochem Mol Biol. 2022. PMID: 36151854 Free PMC article. Review. - The membrane fusion enigma: SNAREs, Sec1/Munc18 proteins, and their accomplices--guilty as charged?
Rizo J, Südhof TC. Rizo J, et al. Annu Rev Cell Dev Biol. 2012;28:279-308. doi: 10.1146/annurev-cellbio-101011-155818. Annu Rev Cell Dev Biol. 2012. PMID: 23057743 Review.
Cited by
- On characterizing protein spatial clusters with correlation approaches.
Shivanandan A, Unnikrishnan J, Radenovic A. Shivanandan A, et al. Sci Rep. 2016 Aug 10;6:31164. doi: 10.1038/srep31164. Sci Rep. 2016. PMID: 27507257 Free PMC article. - Ultraprecise single-molecule localization microscopy enables in situ distance measurements in intact cells.
Coelho S, Baek J, Graus MS, Halstead JM, Nicovich PR, Feher K, Gandhi H, Gooding JJ, Gaus K. Coelho S, et al. Sci Adv. 2020 Apr 17;6(16):eaay8271. doi: 10.1126/sciadv.aay8271. eCollection 2020 Apr. Sci Adv. 2020. PMID: 32494604 Free PMC article. - Superresolution microscope image reconstruction by spatiotemporal object decomposition and association: application in resolving t-tubule structure in skeletal muscle.
Sun M, Huang J, Bunyak F, Gumpper K, De G, Sermersheim M, Liu G, Lin PH, Palaniappan K, Ma J. Sun M, et al. Opt Express. 2014 May 19;22(10):12160-76. doi: 10.1364/OE.22.012160. Opt Express. 2014. PMID: 24921337 Free PMC article. - Reexamination of N-terminal domains of syntaxin-1 in vesicle fusion from central murine synapses.
Vardar G, Salazar-Lázaro A, Brockmann M, Weber-Boyvat M, Zobel S, Kumbol VW, Trimbuch T, Rosenmund C. Vardar G, et al. Elife. 2021 Aug 24;10:e69498. doi: 10.7554/eLife.69498. Elife. 2021. PMID: 34427183 Free PMC article. - Transcellular Nanoalignment of Synaptic Function.
Biederer T, Kaeser PS, Blanpied TA. Biederer T, et al. Neuron. 2017 Nov 1;96(3):680-696. doi: 10.1016/j.neuron.2017.10.006. Neuron. 2017. PMID: 29096080 Free PMC article. Review.
References
- Hata Y, Slaughter CA, Südhof TC. Synaptic vesicle fusion complex contains unc-18 homologue bound to syntaxin. Nature. 1993;366(6453):347–351. - PubMed
- Harrison SD, Broadie K, van de Goor J, Rubin GM. Mutations in the Drosophila Rop gene suggest a function in general secretion and synaptic transmission. Neuron. 1994;13(3):555–566. - PubMed
Publication types
MeSH terms
Substances
LinkOut - more resources
Full Text Sources
Other Literature Sources
Molecular Biology Databases


