Catastrophic nuclear envelope collapse in cancer cell micronuclei - PubMed (original) (raw)
Catastrophic nuclear envelope collapse in cancer cell micronuclei
Emily M Hatch et al. Cell. 2013.
Abstract
During mitotic exit, missegregated chromosomes can recruit their own nuclear envelope (NE) to form micronuclei (MN). MN have reduced functioning compared to primary nuclei in the same cell, although the two compartments appear to be structurally comparable. Here we show that over 60% of MN undergo an irreversible loss of compartmentalization during interphase due to NE collapse. This disruption of the MN, which is induced by defects in nuclear lamina assembly, drastically reduces nuclear functions and can trigger massive DNA damage. MN disruption is associated with chromatin compaction and invasion of endoplasmic reticulum (ER) tubules into the chromatin. We identified disrupted MN in both major subtypes of human non-small-cell lung cancer, suggesting that disrupted MN could be a useful objective biomarker for genomic instability in solid tumors. Our study shows that NE collapse is a key event underlying MN dysfunction and establishes a link between aberrant NE organization and aneuploidy.
Copyright © 2013 Elsevier Inc. All rights reserved.
Figures
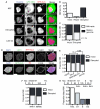
Figure 1. Micronuclei frequently and irreversibly lose compartmentalization in interphase cells
(A) Stills from time-lapse imaging of U2OS 2×RFP-NLS (RFP-NLS) cells expressing 4×GFP-NES (GFP-NES) and labeled with Hoechst. NEF = NE formation. Time is h:m. Scale bar = 10 μm. (B) Quantification of MN fate during interphase from time-lapse imaging. N = 122 MN from 3 experiments. (C) Quantification of MN fate after mitosis from time-lapse imaging of U2OS GFP-IBB mCherry-H2B cells. N = 44 intact MN and 165 disrupted MN from 3 experiments. P > 0.05 by Fisher’s exact test, used for all data in figure. (D) Images of intact (arrows) and disrupted (arrowheads) MN in fixed U2OS cells labeled with antibodies to LSD-1 and lamin B1 (LmnB1) (top) or retinoblastoma (Rb) and lamin A (LmnA) (bottom). Scale bars = 10 μm. (E) Quantification of MN integrity and soluble nuclear protein labeling. N = 300 MN/label from 3 experiments. φ = Phi correlation co-efficient. (F) Quantification of MN integrity in asynchronous cancer cell lines stably expressing GFP-NLS. N = 250 MN/cell line from 3 experiments. (G) Experiment schematic and quantification of MN integrity in non-transformed cell lines 24 h post mitosis. N = 300 MN/cell line from 3 experiments. (H) Experiment schematic (top) and proportion intact MN in U2OS GFP-NLS cells fixed at indicated cell cycle phase. Telophase (telo.) data are from time-lapse imaging analysis. N = 125 MN for telo. and 300 MN/time point from 3 experiments. See also Figure S1 and Movie S1.
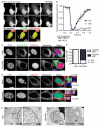
Figure 2. MN disruption occurs by NE collapse and is characterized by ER tubule invasion of the chromatin
(A) Stills from time-lapse imaging of U2OS GFP-IBB, H2B-mCherry cells undergoing PN rupturing and repair (top) and MN disruption (bottom). An asterisk indicates the site of PN NE rupturing (top) and an arrow indicates the MN (bottom). Time is m:s. All scale bars in figure = 10 μm. (B) Analysis of GFP-IBB fractional fluorescence intensity in nucleus during PN NE rupturing and MN disruption. The rupturing half-time, mean, and s.e.m are shown on graph. N = 5. (C) Images of intact and disrupted MN in U2OS RFP-NLS cells expressing Sec61B-GFP and labeled for the luminal ER protein calreticulin. (D) Quantification of Sec61B-GFP presence at the nuclear rim in intact and disrupted MN, as defined by DAPI staining. N = 300 MN/category from 3 experiments. φ = Phi correlation co-efficient. (E) Images of intact and disrupted MN in U2OS GFP-NLS cells expressing V5-tagged reticulon 3 (V5-Rtn3) and labeled for calreticulin. X-z and y-z projections of boxed regions cover 5.48 μm (top) and 5.97 μm (bottom) stacks, respectively. In top (intact MN) projections, GFP-NLS is omitted for clarity. (F) TEM images of intact (left) and disrupted (right) MN in U2OS GFP-NLS cells 8 h and 18 h post-mitotic shake-off, respectively. In the intact MN membranes (arrows) are excluded from the chromatin and in the disrupted MN ER membranes are visible inside the chromatin. See also Figure S2, Movie S2, Movie S3, and Movie S4.
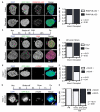
Figure 3. Depletion of lamin B1 in intact MN triggers MN disruption
(A) Images of lamin B1 (LmnB1) morphologies in intact (arrows) and disrupted (arrowheads) MN in fixed U2OS GFP-NLS cells. All scale bars in figure = 10 μm. (B) Quantification of LmnB1 morphology in asynchronous cells. N = 300 MN/category from 3 experiments. All p-values are from Fisher’s exact test. (C) Quantification of MN integrity in asynchronous cell lines expressing indicated lamin B1 constructs. mCh = mCherry. ND = non-degradable. Numbers over graph represent p-values for indicated samples. N = 300 MN/cell line from 3 experiments. (D) Structured illumination images of an intact MN with a discontinuous lamina in a non-LmnB1 depleted U2OS cell (top) and the PN of a U2OS cell expressing LmnB1 shRNA (bottom) labeled with indicated antibodies. (E) Quantification of MN integrity in cell lines expressing mCherry or mCherry-LmnB2. N = 300 MN/cell line from 3 experiments. See also Figure S3, Movie S5, and Movie S6.
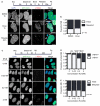
Figure 4. MN disruption causes loss of mRNA transcription, DNA replication, and DNA damage repair and sensing
(A) Images of asynchronous U2OS GFP-NLS cells fixed and labeled with the active RNA polymerase mark anti-RNAPolIIpS2. Intact and disrupted MN are indicated by arrows and arrowheads, respectively, throughout this figure. All scale bars = 10 μm. (B) Quantification of MN integrity and RNAPolIIpS2 labeling. For all quantifications in this figure, n = 300 MN/category from 3 experiments. P-value is from Fisher’s exact test and φ = correlation co-efficient for all graphs in figure. (C) Experiment schematic and images of MN labeled with EdU for 24 h post-mitosis. (D) Quantification of MN integrity and EdU labeling in cells with EdU positive PN. (E) Image of MN labeled with anti-γ-H2AX antibody, which marks DSBs, in asynchronous cells. (F) Quantification of MN integrity and γ-H2AX labeling. (G) Experiment schematic and image of G1 cells treated with doxorubicin (doxo) for 1 h and labeled with anti-γ-H2AX. (H) Proportion of PN and intact and disrupted MN that contain more than one γ-H2AX focus or an enlarged γ-H2AX focus after 1 h doxo incubation. P and φ values compare only the intact and disrupted MN. See also Figure S4.
Figure 5. DNA damage does not induce MN disruption
(A) Experiment schematic and images of U2OS cells labeled with anti-γ-H2AX 20 h after 1 h incubation in DMSO or doxorubicin (doxo). All scale bars = 10 μm. Arrows and arrowheads indicate intact and disrupted MN, respectively. (B) Quantification of MN integrity in cells treated as in (A). P-value > 0.05, determined by Fisher’s exact test. N = 300 MN/condition from 3 experiments. (C) Experiment schematic and images of synchronized cells treated with HU at the indicated concentrations for 20 h, fixed, and labeled with antibodies to γ-H2AX. (D) Quantification of intact MN with multiple γ-H2AX foci 20 h after HU incubation. P-values above graph refer to indicated samples determined by Fisher’s exact test. N = 250 MN/concentration from 3 experiments. (E) Quantification of MN integrity in cells incubated in HU for 20 h. N = 250 MN/concentration from 3 experiments. P-value > 0.05 by χ2 analysis.
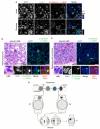
Figure 6. Disrupted MN are present in non-small cell lung cancer tumors
(A) Immunofluorescence of thin paraffin sections of a non-small cell lung cancer (NSCLC) tumor showing intact (arrow) and disrupted (arrowhead) MN. Sections were labeled with antibodies to E-cadherin, γ-H2AX, and LSD-1. Scale bars = 10 μm. Images are maximum intensity projections of 4 μm (top) and 5.5 μm (bottom) z-stacks. (B and C) Immunofluorescence of adenocarcinoma and squamous cell carcinoma tumors. Sections were labeled with antibodies to E-cadherin and γ-H2AX and stained with DAPI and Sypro Ruby. Lower panels are enlarged images of boxed area. Pseduo-hematoxylin and eosin staining (H&E) images were generated by pseudo-coloring merged DAPI/Sypro Ruby images. Arrows in (C) indicate additional disrupted MN. Scale bars = 50 μm. (D) Model of MN disruption. A lagging chromosome forms a MN upon mitotic exit. The NE of the MN may already be abnormal at this time. At some point during interphase, lamina disorganization triggers NE collapse and loss of proteins from the MN. After NE collapse, the MN chromatin becomes compacted and permeated by tubular ER. This chromatin either segregates normally or becomes a MN again in the next mitosis. See also Figure S5.
Similar articles
- Nuclear envelope assembly defects link mitotic errors to chromothripsis.
Liu S, Kwon M, Mannino M, Yang N, Renda F, Khodjakov A, Pellman D. Liu S, et al. Nature. 2018 Sep;561(7724):551-555. doi: 10.1038/s41586-018-0534-z. Epub 2018 Sep 19. Nature. 2018. PMID: 30232450 Free PMC article. - Small spaces, big problems: The abnormal nucleoplasm of micronuclei and its consequences.
Zych MG, Hatch EM. Zych MG, et al. Curr Opin Struct Biol. 2024 Aug;87:102839. doi: 10.1016/j.sbi.2024.102839. Epub 2024 May 18. Curr Opin Struct Biol. 2024. PMID: 38763098 Review. - Chromosome length and gene density contribute to micronuclear membrane stability.
Mammel AE, Huang HZ, Gunn AL, Choo E, Hatch EM. Mammel AE, et al. Life Sci Alliance. 2021 Nov 17;5(2):e202101210. doi: 10.26508/lsa.202101210. Print 2022 Feb. Life Sci Alliance. 2021. PMID: 34789512 Free PMC article. - Transient nuclear envelope rupturing during interphase in human cancer cells.
Vargas JD, Hatch EM, Anderson DJ, Hetzer MW. Vargas JD, et al. Nucleus. 2012 Jan-Feb;3(1):88-100. doi: 10.4161/nucl.18954. Nucleus. 2012. PMID: 22567193 Free PMC article. - Impaired nuclear functions in micronuclei results in genome instability and chromothripsis.
Terradas M, Martín M, Genescà A. Terradas M, et al. Arch Toxicol. 2016 Nov;90(11):2657-2667. doi: 10.1007/s00204-016-1818-4. Epub 2016 Aug 19. Arch Toxicol. 2016. PMID: 27542123 Review.
Cited by
- Cellular and Molecular Features of Developmentally Programmed Genome Rearrangement in a Vertebrate (Sea Lamprey: Petromyzon marinus).
Timoshevskiy VA, Herdy JR, Keinath MC, Smith JJ. Timoshevskiy VA, et al. PLoS Genet. 2016 Jun 24;12(6):e1006103. doi: 10.1371/journal.pgen.1006103. eCollection 2016 Jun. PLoS Genet. 2016. PMID: 27341395 Free PMC article. - Cancer-associated mutations in the condensin II subunit CAPH2 cause genomic instability through telomere dysfunction and anaphase chromosome bridges.
Weyburne E, Bosco G. Weyburne E, et al. J Cell Physiol. 2021 May;236(5):3579-3598. doi: 10.1002/jcp.30113. Epub 2020 Oct 20. J Cell Physiol. 2021. PMID: 33078399 Free PMC article. - Rationale for combination of paclitaxel and CDK4/6 inhibitor in ovarian cancer therapy - non-mitotic mechanisms of paclitaxel.
Smith ER, Huang M, Schlumbrecht MP, George SHL, Xu XX. Smith ER, et al. Front Oncol. 2022 Sep 15;12:907520. doi: 10.3389/fonc.2022.907520. eCollection 2022. Front Oncol. 2022. PMID: 36185294 Free PMC article. Review. - Gaussian curvature dilutes the nuclear lamina, favoring nuclear rupture, especially at high strain rate.
Pfeifer CR, Tobin MP, Cho S, Vashisth M, Dooling LJ, Vazquez LL, Ricci-De Lucca EG, Simon KT, Discher DE. Pfeifer CR, et al. Nucleus. 2022 Dec;13(1):129-143. doi: 10.1080/19491034.2022.2045726. Nucleus. 2022. PMID: 35293271 Free PMC article. - TDP-43 aggregation inside micronuclei reveals a potential mechanism for protein inclusion formation in ALS.
Droppelmann CA, Campos-Melo D, Moszczynski AJ, Amzil H, Strong MJ. Droppelmann CA, et al. Sci Rep. 2019 Dec 27;9(1):19928. doi: 10.1038/s41598-019-56483-y. Sci Rep. 2019. PMID: 31882736 Free PMC article.
References
- Abràmoff MD, Hospitals I, Magalhães PJ, Abràmoff M. Image Processing with ImageJ. Biophotonics International. 2004;11:36–42.
- Anderson DJ, Hetzer MW. Nuclear envelope formation by chromatin-mediated reorganization of the endoplasmic reticulum. Nat Cell Biol. 2007;9:1160–1166. - PubMed
- Anderson DJ, Hetzer MW. Shaping the endoplasmic reticulum into the nuclear envelope. J Cell Sci. 2008b;121:137–142. - PubMed
Publication types
MeSH terms
Substances
Grants and funding
- P30CA014118195/CA/NCI NIH HHS/United States
- R01GM098749/GM/NIGMS NIH HHS/United States
- GM103412/GM/NIGMS NIH HHS/United States
- R01 GM098749/GM/NIGMS NIH HHS/United States
- P30 CA014195/CA/NCI NIH HHS/United States
LinkOut - more resources
Full Text Sources
Other Literature Sources
Medical
