The Xist lncRNA exploits three-dimensional genome architecture to spread across the X chromosome - PubMed (original) (raw)
. 2013 Aug 16;341(6147):1237973.
doi: 10.1126/science.1237973. Epub 2013 Jul 4.
Amy Pandya-Jones, Patrick McDonel, Alexander Shishkin, Klara Sirokman, Christine Surka, Sabah Kadri, Jeffrey Xing, Alon Goren, Eric S Lander, Kathrin Plath, Mitchell Guttman
Affiliations
- PMID: 23828888
- PMCID: PMC3778663
- DOI: 10.1126/science.1237973
The Xist lncRNA exploits three-dimensional genome architecture to spread across the X chromosome
Jesse M Engreitz et al. Science. 2013.
Abstract
Many large noncoding RNAs (lncRNAs) regulate chromatin, but the mechanisms by which they localize to genomic targets remain unexplored. We investigated the localization mechanisms of the Xist lncRNA during X-chromosome inactivation (XCI), a paradigm of lncRNA-mediated chromatin regulation. During the maintenance of XCI, Xist binds broadly across the X chromosome. During initiation of XCI, Xist initially transfers to distal regions across the X chromosome that are not defined by specific sequences. Instead, Xist identifies these regions by exploiting the three-dimensional conformation of the X chromosome. Xist requires its silencing domain to spread across actively transcribed regions and thereby access the entire chromosome. These findings suggest a model in which Xist coats the X chromosome by searching in three dimensions, modifying chromosome structure, and spreading to newly accessible locations.
Figures
Fig. 1. RNA Antisense Purification accurately purifies lncRNA-chromatin interactions
(A) Schematic diagram of RAP. Biotinylated probes (blue) are hybridized to the target RNA (red) crosslinked to proteins and DNA. Gray inset: 120-mer antisense capture probes are designed to tile across the entire target RNA. (B) RT-qPCR of the RNA captured using antisense probes to Xist (Xist RAP, black) or sense probes to Xist (Control RAP, gray) in MLFs. Enrichments represent mean +/− SEM (N = 3 replicate experiments) and are normalized to the mean of the sense control experiments. We note that Tsix, an antisense transcript overlapping Xist, is not expressed in MLFs. (C) RNA sequencing reads originating from the Xist transcript (dark gray) and all other cellular RNAs (light gray) for polyA-selected RNA (left) and RNA captured using antisense probes for the Xist RNA (right) (35). (D) DNA sequencing reads aligning to each chromosome after purification with antisense probes (Xist RAP, black) and sense probes (Control RAP, light gray), and input genomic DNA (dark gray) in MLFs.
Fig. 2. High-resolution mapping of Xist localization on the inactive X-chromosome in differentiated female cells
(A) Xist enrichment over input (dark gray), H3K27me3 enrichment over input (red line), and gene density (blue line) (35) across the entire X-chromosome in female MLFs. (B) Zoom in on a highly-enriched Xist region (light-red box, chrX:95,000,000-99,000,000) shows Xist (black) and H3K27me3 (red) enrichments. (C) Cumulative distribution plot comparing Xist enrichment across all 10-Kb windows on the X-chromosome (black) and on autosomes (gray). Dashed lines demarcate the least- and most-highly enriched regions on the X-chromosome. (D) Correlation between Xist enrichment and the ratio of expression from the inactive X (Xi) and active X (Xa) for known escape genes (39). (E) Xist enrichment (chrX:17,031,000-19,901,000) across two of the least-enriched regions (blue boxes). (F) Xist enrichment around the Xist genomic locus including a least-enriched region (blue box). Xist enrichment at the Xist locus (gray arrow) extends above the _y_-axis maximum.
Fig. 3. High-resolution view of Xist spreading during initiation of XCI
(A) We replaced the 1,027 bases upstream of Xist with a tetracycline-responsive (TetO) promoter in male mouse ES cells (35). (B) Representative FISH images for the Xist RNA (red) and DAPI staining of the nucleus (blue) after Xist induction with doxycycline. Xist FISH signals were classified into categories – including no signal, spot, small cloud, and large cloud – at each time point (35). (C) Xist RAP enrichments over input across the X-chromosome for the same time points as in (B). The _y_-axis scale (0-50) is the same for all time points. Xist enrichment at the Xist locus extends above _y_-axis maximum. (D) Two proposed models for Xist spreading (gray arrows) from its transcription locus (tick mark) across the chromosome. (E) A zoom in on the _y_-axis of Xist enrichment after one hour of Xist induction. (F) Xist enrichments from RAP in wild-type female ES cells after 6 hours of differentiation. Early sites are defined by significant deviations (P < 0.05) above the local (10-Mb) average (35).
Fig. 4. Early Xist localization correlates with the 3-D proximity contacts of the Xist transcription locus
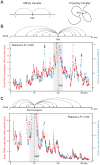
(A) Two models for how Xist spreads to early initiation sites (marked by gray arrows in all panels). Gray boxes on the left model represent hypothetical high-affinity interaction sites. (B) Correlation between Xist RNA localization (red) after one hour of Xist induction and Hi-C contact frequencies (blue) between distal sites and the Xist genomic locus (dashed line). Black arrows point to selected regions with lower Xist RNA enrichments than would be expected from the Hi-C contact frequencies. (C) Correlation between Xist transgene RNA localization (red) after three hours of induction of the Xist cDNA transgene in the Hprt locus and Hi-C contact frequencies (blue) between distal sites and the Hprt integration locus (dashed line). Correlation calculations exclude the shaded gray regions (10-Mb on each side). Contact frequencies represent normalized Hi-C interaction counts in male ES cells between each window and the window containing the Xist or Hprt locus (35).
Fig. 5. The A-repeat deletion of Xist cannot spread over the active regions of the X-chromosome
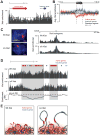
(A) Xist enrichment over representative genes at chrX:45,252,000-45,408,000. Dashed line denotes the average enrichment for the entire region. Solid line represents the smoothed enrichment in sliding windows across the region. (B) Xist enrichment averaged over all active genes (red line, N = 608), inactive genes (blue line, N = 595), and randomly permuted regions across the X-chromosome (black line) (35). Shaded regions represent 95% confidence intervals for the average enrichment. (C) Localization of wild-type Xist (wt Xist, top) and Xist lacking the A-repeat (ΔA Xist, bottom) by RNA FISH (left) and RAP (right) across the X-chromosome. (D) Comparison of wt and ΔA Xist enrichment across a representative region at chrX:44,600,000-47,100,000. Gray boxes mark regions that are depleted for Xist localization in ΔA versus wt Xist. All panels present data from three hours after Xist induction in undifferentiated male ES cells, where Xist is expressed from its endogenous locus (A-B) or from the Hprt locus (C-D). Genes were classified as active or inactive using RNA-Seq data from undifferentiated male ES cells (35). (D) Model: in the presence of the A-repeat (left), Xist localizes across the entire X-chromosome (red cloud) but is initially excluded from active genes (red arrows). In the absence of the A-repeat (right), Xist accumulates on the periphery of active gene-dense regions but cannot spread to actively transcribed genes (red arrows) or inactive genes (blue arrows) that lie within these regions.
Fig. 6. A model for how Xist exploits and alters three-dimensional genome architecture to spread across the X-chromosome
Upon induction of expression in ES cells (left), Xist (red) spreads to spatially proximal sites on the periphery of active gene-dense regions (black). Gene-poor regions (blue, purple) contact the Xist transcription locus infrequently, leading to slower spreading to these regions. When encountering a new region (left inset), Xist interacts with chromatin through a degenerate localization mechanism, possibly through the matrix protein hnRNP U (30, 34), and uses its A-repeat domain to spread over active genes. Xist may then recruit PRC2 (14) and other proteins (56) to modify and compact chromatin, thereby repositioning nearby chromosomal regions into the Xist RNA compartment (red cloud, right inset). These structural changes may propagate Xist spreading (right) by pulling new regions (green, yellow) of the chromosome into closer proximity to the Xist genomic locus and the growing Xist compartment.
Comment in
- Molecular biology. Long noncoding RNAs Xist in three dimensions.
Dimond A, Fraser P. Dimond A, et al. Science. 2013 Aug 16;341(6147):720-1. doi: 10.1126/science.1243257. Science. 2013. PMID: 23950517 No abstract available. - X-inactivation: Xist RNA uses chromosome contacts to coat the X.
Leung KN, Panning B. Leung KN, et al. Curr Biol. 2014 Jan 20;24(2):R80-R82. doi: 10.1016/j.cub.2013.11.052. Curr Biol. 2014. PMID: 24456982 Free PMC article.
Similar articles
- High-resolution Xist binding maps reveal two-step spreading during X-chromosome inactivation.
Simon MD, Pinter SF, Fang R, Sarma K, Rutenberg-Schoenberg M, Bowman SK, Kesner BA, Maier VK, Kingston RE, Lee JT. Simon MD, et al. Nature. 2013 Dec 19;504(7480):465-469. doi: 10.1038/nature12719. Epub 2013 Oct 27. Nature. 2013. PMID: 24162848 Free PMC article. - Spen links RNA-mediated endogenous retrovirus silencing and X chromosome inactivation.
Carter AC, Xu J, Nakamoto MY, Wei Y, Zarnegar BJ, Shi Q, Broughton JP, Ransom RC, Salhotra A, Nagaraja SD, Li R, Dou DR, Yost KE, Cho SW, Mistry A, Longaker MT, Khavari PA, Batey RT, Wuttke DS, Chang HY. Carter AC, et al. Elife. 2020 May 7;9:e54508. doi: 10.7554/eLife.54508. Elife. 2020. PMID: 32379046 Free PMC article. - Structural organization of the inactive X chromosome in the mouse.
Giorgetti L, Lajoie BR, Carter AC, Attia M, Zhan Y, Xu J, Chen CJ, Kaplan N, Chang HY, Heard E, Dekker J. Giorgetti L, et al. Nature. 2016 Jul 28;535(7613):575-9. doi: 10.1038/nature18589. Epub 2016 Jul 18. Nature. 2016. PMID: 27437574 Free PMC article. - Xist drives spatial compartmentalization of DNA and protein to orchestrate initiation and maintenance of X inactivation.
Strehle M, Guttman M. Strehle M, et al. Curr Opin Cell Biol. 2020 Jun;64:139-147. doi: 10.1016/j.ceb.2020.04.009. Epub 2020 Jun 11. Curr Opin Cell Biol. 2020. PMID: 32535328 Review. - Mechanistic insights in X-chromosome inactivation.
Lu Z, Carter AC, Chang HY. Lu Z, et al. Philos Trans R Soc Lond B Biol Sci. 2017 Nov 5;372(1733):20160356. doi: 10.1098/rstb.2016.0356. Philos Trans R Soc Lond B Biol Sci. 2017. PMID: 28947655 Free PMC article. Review.
Cited by
- Epigenetic regulation in myocardial infarction: Non-coding RNAs and exosomal non-coding RNAs.
Fadaei S, Zarepour F, Parvaresh M, Motamedzadeh A, Tamehri Zadeh SS, Sheida A, Shabani M, Hamblin MR, Rezaee M, Zarei M, Mirzaei H. Fadaei S, et al. Front Cardiovasc Med. 2022 Nov 10;9:1014961. doi: 10.3389/fcvm.2022.1014961. eCollection 2022. Front Cardiovasc Med. 2022. PMID: 36440025 Free PMC article. Review. - RNA-Centric Approaches to Profile the RNA-Protein Interaction Landscape on Selected RNAs.
Gerber AP. Gerber AP. Noncoding RNA. 2021 Feb 15;7(1):11. doi: 10.3390/ncrna7010011. Noncoding RNA. 2021. PMID: 33671874 Free PMC article. Review. - Functional identification of cis-regulatory long noncoding RNAs at controlled false discovery rates.
Dhaka B, Zimmerli M, Hanhart D, Moser MB, Guillen-Ramirez H, Mishra S, Esposito R, Polidori T, Widmer M, García-Pérez R, Julio MK, Pervouchine D, Melé M, Chouvardas P, Johnson R. Dhaka B, et al. Nucleic Acids Res. 2024 Apr 12;52(6):2821-2835. doi: 10.1093/nar/gkae075. Nucleic Acids Res. 2024. PMID: 38348970 Free PMC article. - Chromatin architecture and virulence-related gene expression in eukaryotic microbial pathogens.
Juárez-Reyes A, Castaño I. Juárez-Reyes A, et al. Curr Genet. 2019 Apr;65(2):435-443. doi: 10.1007/s00294-018-0903-z. Epub 2018 Nov 15. Curr Genet. 2019. PMID: 30443783 Review. - LINC00240 knockdown inhibits nasopharyngeal carcinoma progress by targeting miR-26a-5p.
Chen X, Wu G, Qing J, Li C, Chen X, Shen J. Chen X, et al. J Clin Lab Anal. 2022 May;36(5):e24424. doi: 10.1002/jcla.24424. Epub 2022 Apr 14. J Clin Lab Anal. 2022. PMID: 35421264 Free PMC article.
References
- Carninci P, et al. The transcriptional landscape of the mammalian genome. Science. 2005 Sep 2;309:1559. - PubMed
Publication types
MeSH terms
Substances
Grants and funding
- 1F32GM103139-01/GM/NIGMS NIH HHS/United States
- F32 GM103139/GM/NIGMS NIH HHS/United States
- DP5OD012190/OD/NIH HHS/United States
- P01 GM099134/GM/NIGMS NIH HHS/United States
- P50 HG006193/HG/NHGRI NIH HHS/United States
- P01GM099134/GM/NIGMS NIH HHS/United States
- P50HG006193/HG/NHGRI NIH HHS/United States
- DP5 OD012190/OD/NIH HHS/United States
LinkOut - more resources
Full Text Sources
Other Literature Sources
Molecular Biology Databases


