Global epigenomic reconfiguration during mammalian brain development - PubMed (original) (raw)
. 2013 Aug 9;341(6146):1237905.
doi: 10.1126/science.1237905. Epub 2013 Jul 4.
Eran A Mukamel # 3, Joseph R Nery 1, Mark Urich 1, Clare A Puddifoot 3, Nicholas D Johnson 3, Jacinta Lucero 3, Yun Huang 4, Andrew J Dwork 5 6, Matthew D Schultz 1 7, Miao Yu 8, Julian Tonti-Filippini 2, Holger Heyn 9, Shijun Hu 10, Joseph C Wu 10, Anjana Rao 4, Manel Esteller 9 11, Chuan He 8, Fatemeh G Haghighi 5, Terrence J Sejnowski 3 12 13, M Margarita Behrens 3, Joseph R Ecker 1 13
Affiliations
- PMID: 23828890
- PMCID: PMC3785061
- DOI: 10.1126/science.1237905
Global epigenomic reconfiguration during mammalian brain development
Ryan Lister et al. Science. 2013.
Abstract
DNA methylation is implicated in mammalian brain development and plasticity underlying learning and memory. We report the genome-wide composition, patterning, cell specificity, and dynamics of DNA methylation at single-base resolution in human and mouse frontal cortex throughout their lifespan. Widespread methylome reconfiguration occurs during fetal to young adult development, coincident with synaptogenesis. During this period, highly conserved non-CG methylation (mCH) accumulates in neurons, but not glia, to become the dominant form of methylation in the human neuronal genome. Moreover, we found an mCH signature that identifies genes escaping X-chromosome inactivation. Last, whole-genome single-base resolution 5-hydroxymethylcytosine (hmC) maps revealed that hmC marks fetal brain cell genomes at putative regulatory regions that are CG-demethylated and activated in the adult brain and that CG demethylation at these hmC-poised loci depends on Tet2 activity.
Figures
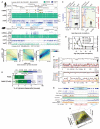
Fig. 1. Methylcytosine in mammalian frontal cortex is developmentally dynamic and abundant in CG and CH contexts
(A) Browser representation of mC and mRNA transcript abundance in human and mouse frontal cortex and human ES cells. Chr2, chromosome 2. (B) mCH/CH within gene bodies exhibits opposite correlation with gene expression in ES cells (ESC) and brain. Contours show data point density, and red line shows smoothed mCH/CH as a function of mRNA. a.u., arbitrary units. (C) Synaptic density (for mouse, per 100 μm2; for human, per 100 μm3) and mC level in CG and CH contexts through development in mouse and human frontal cortex. †Synaptic density quantitation from De Felipe et al. (27) and Huttenlocher and Dabholkar (28). (D) DNA methyltransferase mRNA and protein abundance (mean ± SEM) in mouse frontal cortex through development. FPKM, fragments per kilobase of exon per million fragments mapped. (E) Fraction of cytosine base calls with each modification in fetal and adult mouse frontal cortex. (F) Cortex mC level in CG and CH contexts throughout mouse and human chromosome 12 in 100-kb bins smoothed with ~1-Mb resolution. CEN, centrosome. (G) Transcript abundance, chromatin accessibility [8-week mouse cortex ChIP input and DNaseI hypersensitivity (HS) normalized read density], and mC levels in 5-kb bins at the mouse immunoglobulin VH locus. (H) Density (z) plot of 10-week mouse frontal cortex mCH level (x) versus 8-week mouse cortex ChIP-input normalized read density (y) for all 10-kb bins of the mouse genome.
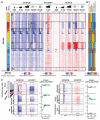
Fig. 2. mCH is positionally conserved and is the dominant form of DNA methylation in human neurons
(A) Browser representation of mCG and mCH in NeuN+ and NeuN− cells. Human NeuN+/NeuN− samples: R1, 53-year-old female; R2, 55-year-old male. Mouse NeuN+/NeuN− samples: R1, 7-week males; R2, 6-week females; R3, 12-month females (not shown). (B) Percentage of methylated base calls in each sequence context throughout the genome. (C) Box and whisker plot of mCG and mCH level in neurons and glia at genomic regions bound by Dnmt3a versus a random set. Whiskers indicate 1.5 times the interquartile range. (D) mCH correlation between NeuN+ and NeuN− cells in mouse and human, measured in 10-kb bins. (E) Browser representation of mCH sites in neurons. Scatter plots (right) show consistent mCH/CH at all single sites in a 20-kb window overlapping the example region (left). (F) Correlation analysis of methylation state at single sites between neurons and ES cells in human and mouse. Correlation values are normalized by a simulation (62).
Fig. 3. mCH is enriched in genes that escape X inactivation
(A) Browser representation showing mCH-hypermethylated female human and mouse genes that escape X inactivation (shaded genes). (B) Box and whisker plots of gender differences in promoter mCG and intragenic mCH in inactivated and escapee genes on human chrX. (C) Scatter plot of gender differences in mCG and mCH in human chrX genes. Reported X inactivated and escapee genes: *Carrel and Willard (49); §Sharp et al. (50); †predicted escapee genes, and autosomal (Chr2) genes are indicated. (D) Discriminability analysis of genes that escape female X inactivation using mC data, showing correct versus false detection rate mapped for all possible mC/C thresholds.
Fig. 4. Celltype–specific and developmental differences in mC between mouse neurons and glia
(A) Heat-map representation of 25,260 mouse genes organized in gene sets identified by _k_-means clustering using normalized genic mCG and mCH levels in adult developmental and NeuN+ and NeuN− samples. Left-hand plot shows mRNA abundance. (B) Enrichment or depletion of each cluster for developmental and cell-type specific gene sets. n.s., not significant (FET, FDR < 0.05). (C) mCG and mCH throughout gene body and flanking 100 kb for indicated gene sets. Transcript abundance (mRNA-Seq FPKM) over mouse development is shown for the same gene sets. Color scales are as in (A).
Fig. 5. hmCG is enriched within active genomic regions in fetal and adult mouse brain
(A) hmCG level in 6-week mouse frontal cortex for autosomes and ChrX. (B) Median hmCG level within genomic features (error bars 32nd to 68th percentile). enh, enhancer. (C) Median normalized hmCG throughout gene body and flanking 100 kb for indicated gene sets. Bars show absolute hmCG/CG levels within gene bodies for each class. (D) mC and hmC throughout gene body and flanking 100 kb for each. Transcript abundance (mRNA-Seq FPKM) during mouse development is also shown (left).
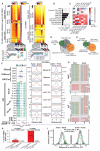
Fig. 6. Developmental and cell type–specific differential mCG
(A) Heat map of absolute mCG level in CG-DMRs identified between neurons and glia and over development in mouse (left) and human (right). (B) Fraction of all CG-DMRs located in distinct genomic features in mouse. (C) Enrichment or depletion of distinct cell type–specific and developmental CG-DMR sets within genomic features from (B). (D and E) Intersection of developmentally dynamic CG-DMRs and (D) DNaseI hypersensitive sites or (E) enhancers in mouse brain in thousands. (F) Browser representation of mouse developmentally dynamic CG-DMRs and quantification of local enrichment of chromatin modifications, genome accessibility, and mC. (G) TAB-Seq reads showing fetal-specific hmCG in the Fetal>Adult CG-DMR in mouse. (H) Proportion of mouse developmental CG-DMRs where mCG/CG is significantly increased or decreased in Tet2 knockout mice. (I) Distribution of mCG level difference between wild-type (WT) and Tet2 mutantat mouse CG-DMRs. Significantly different DMRs are indicated by coloration.
Comment in
- Genetics. The maturing brain methylome.
Gabel HW, Greenberg ME. Gabel HW, et al. Science. 2013 Aug 9;341(6146):626-7. doi: 10.1126/science.1242671. Science. 2013. PMID: 23929975 Free PMC article. No abstract available.
Similar articles
- Studying the epigenome using next generation sequencing.
Ku CS, Naidoo N, Wu M, Soong R. Ku CS, et al. J Med Genet. 2011 Nov;48(11):721-30. doi: 10.1136/jmedgenet-2011-100242. Epub 2011 Aug 8. J Med Genet. 2011. PMID: 21825079 Review. - Whole-genome analysis of 5-hydroxymethylcytosine and 5-methylcytosine at base resolution in the human brain.
Wen L, Li X, Yan L, Tan Y, Li R, Zhao Y, Wang Y, Xie J, Zhang Y, Song C, Yu M, Liu X, Zhu P, Li X, Hou Y, Guo H, Wu X, He C, Li R, Tang F, Qiao J. Wen L, et al. Genome Biol. 2014 Mar 4;15(3):R49. doi: 10.1186/gb-2014-15-3-r49. Genome Biol. 2014. PMID: 24594098 Free PMC article. - 5-hmC-mediated epigenetic dynamics during postnatal neurodevelopment and aging.
Szulwach KE, Li X, Li Y, Song CX, Wu H, Dai Q, Irier H, Upadhyay AK, Gearing M, Levey AI, Vasanthakumar A, Godley LA, Chang Q, Cheng X, He C, Jin P. Szulwach KE, et al. Nat Neurosci. 2011 Oct 30;14(12):1607-16. doi: 10.1038/nn.2959. Nat Neurosci. 2011. PMID: 22037496 Free PMC article. - Genetics. The maturing brain methylome.
Gabel HW, Greenberg ME. Gabel HW, et al. Science. 2013 Aug 9;341(6146):626-7. doi: 10.1126/science.1242671. Science. 2013. PMID: 23929975 Free PMC article. No abstract available. - 5-Hydroxymethylcytosine: generation, fate, and genomic distribution.
Shen L, Zhang Y. Shen L, et al. Curr Opin Cell Biol. 2013 Jun;25(3):289-96. doi: 10.1016/j.ceb.2013.02.017. Epub 2013 Mar 13. Curr Opin Cell Biol. 2013. PMID: 23498661 Free PMC article. Review.
Cited by
- Base-resolution methylation patterns accurately predict transcription factor bindings in vivo.
Xu T, Li B, Zhao M, Szulwach KE, Street RC, Lin L, Yao B, Zhang F, Jin P, Wu H, Qin ZS. Xu T, et al. Nucleic Acids Res. 2015 Mar 11;43(5):2757-66. doi: 10.1093/nar/gkv151. Epub 2015 Feb 26. Nucleic Acids Res. 2015. PMID: 25722376 Free PMC article. - Neuroepigenomics: Resources, Obstacles, and Opportunities.
Satterlee JS, Beckel-Mitchener A, Little R, Procaccini D, Rutter JL, Lossie AC. Satterlee JS, et al. Neuroepigenetics. 2015 Jan 1;1:2-13. doi: 10.1016/j.nepig.2014.10.001. Neuroepigenetics. 2015. PMID: 25722961 Free PMC article. - Brain feminization requires active repression of masculinization via DNA methylation.
Nugent BM, Wright CL, Shetty AC, Hodes GE, Lenz KM, Mahurkar A, Russo SJ, Devine SE, McCarthy MM. Nugent BM, et al. Nat Neurosci. 2015 May;18(5):690-7. doi: 10.1038/nn.3988. Epub 2015 Mar 30. Nat Neurosci. 2015. PMID: 25821913 Free PMC article. - Single-molecule micromanipulation studies of methylated DNA.
Zaichuk T, Marko JF. Zaichuk T, et al. Biophys J. 2021 Jun 1;120(11):2148-2155. doi: 10.1016/j.bpj.2021.03.039. Epub 2021 Apr 8. Biophys J. 2021. PMID: 33838135 Free PMC article. - Epigenetic mechanisms in neurogenesis.
Yao B, Christian KM, He C, Jin P, Ming GL, Song H. Yao B, et al. Nat Rev Neurosci. 2016 Sep;17(9):537-49. doi: 10.1038/nrn.2016.70. Epub 2016 Jun 23. Nat Rev Neurosci. 2016. PMID: 27334043 Free PMC article. Review.
References
- Miller CA, Sweatt JD. Covalent modification of DNA regulates memory formation. Neuron. 2007;53:857–869. doi: 10.1016/j.neuron.2007.02.022; pmid: 17359920. - PubMed
Publication types
MeSH terms
Substances
Grants and funding
- K99NS080911/NS/NINDS NIH HHS/United States
- HD065812/HD/NICHD NIH HHS/United States
- R01 AI044432/AI/NIAID NIH HHS/United States
- R01 MH094670/MH/NIMH NIH HHS/United States
- HG006827/HG/NHGRI NIH HHS/United States
- AI44432/AI/NIAID NIH HHS/United States
- R01 CA151535/CA/NCI NIH HHS/United States
- CA151535/CA/NCI NIH HHS/United States
- R01 MH094774/MH/NIMH NIH HHS/United States
- K99 NS080911/NS/NINDS NIH HHS/United States
- R01 HD065812/HD/NICHD NIH HHS/United States
- MH094670/MH/NIMH NIH HHS/United States
- R01 HG006827/HG/NHGRI NIH HHS/United States
- HHMI_/Howard Hughes Medical Institute/United States
LinkOut - more resources
Full Text Sources
Other Literature Sources
Molecular Biology Databases


