Mutations in STT3A and STT3B cause two congenital disorders of glycosylation - PubMed (original) (raw)
. 2013 Nov 15;22(22):4638-45.
doi: 10.1093/hmg/ddt312. Epub 2013 Jul 10.
Affiliations
- PMID: 23842455
- PMCID: PMC3888133
- DOI: 10.1093/hmg/ddt312
Mutations in STT3A and STT3B cause two congenital disorders of glycosylation
Shiteshu Shrimal et al. Hum Mol Genet. 2013.
Abstract
We describe two unreported types of congenital disorders of glycosylation (CDG) which are caused by mutations in different isoforms of the catalytic subunit of the oligosaccharyltransferase (OST). Each isoform is encoded by a different gene (STT3A or STT3B), resides in a different OST complex and has distinct donor and acceptor substrate specificities with partially overlapping functions in N-glycosylation. The two cases from unrelated consanguineous families both show neurologic abnormalities, hypotonia, intellectual disability, failure to thrive and feeding problems. A homozygous mutation (c.1877T > C) in STT3A causes a p.Val626Ala change and a homozygous intronic mutation (c.1539 + 20G > T) in STT3B causes the other disorder. Both mutations impair glycosylation of a GFP biomarker and are rescued with the corresponding cDNA. Glycosylation of STT3A- and STT3B-specific acceptors is decreased in fibroblasts carrying the corresponding mutated gene and expression of the STT3A (p.Val626Ala) allele in STT3A-deficient HeLa cells does not rescue glycosylation. No additional cases were found in our collection or in reviewing various databases. The STT3A mutation significantly impairs glycosylation of the biomarker transferrin, but the STT3B mutation only slightly affects its glycosylation. Additional cases of STT3B-CDG may be missed by transferrin analysis and will require exome or genome sequencing.
Figures
Figure 1.
Identification of two consanguineous families with Sanger sequence confirmed mutations in STT3A and STT3B. (A) Family-1 pedigree shows two affected individuals from a consanguineous marriage where homozygosity mapping was performed on Case-1. Lower panel shows Sanger sequence confirmation of the STT3A c.1877T > C mutation (p.Val626Ala) in the affected male. Sample from the affected female was not available for testing. (B) Family-2 pedigree shows consanguinity and homozygosity mapping was performed on the affected male Case-2. Lower panel shows Sanger sequence confirmation of the STT3B c.1539 + 20G > T mutation. Filled in symbols denote affected individuals and filled in symbol with a line through it means individual is deceased.
Figure 2.
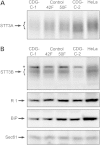
Reduced expression of STT3A and STT3B in Case-1 and Case-2 fibroblasts. (A) STT3A was immunoprecipitated from total cell extracts of fibroblasts (Case-1, CDG C-1; Case-2, CDG C-2; control, 42F and 50F) or HeLa cells that were pulse-labeled for 50 min with Tran-35S label. Equal quantities of 35S labeled protein were used for each immunoprecipitation. (B) Protein immunoblot detection of STT3B, ribophorin 1 (R 1), the ER chaperone BiP and the protein translocation channel (Sec61). Equal amounts of protein (100 µg) were electrophoresed in each lane. HeLa cell extracts serve as protein mobility controls. The asterisk designates a background band that migrates in the vicinity of STT3B. These results are representative of two individual experiments.
Figure 3.
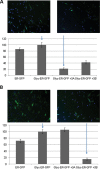
STT3A and STT3B complementation measured by GFP fluorescence in cells. Cells from Case-1 (Fig. 3A) and Case-2 (Fig. 3B) were electroporated with the ER-GFP and the Glyc-ER-GFP in the presence of a control vector or vector expressing STT3A-DDK-His or STT3B-Myc-DDK. Anti-FLAG (DDK) antibody was used to identify transfected cells, and detected by a far-red linked secondary antibody. On top of its inherent green fluorescence, total GFP expression was monitored by a GFP antibody followed by a Cy3-linked secondary antibody. Images were monitored by fluorescent microscopy and processed using Image J software. The quantitation of the relative GFP fluorescence per cell is shown in the histogram and was calculated from at least 150 cells in each case. Error bars show standard deviation.
Figure 4.
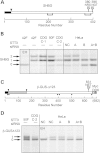
Hypoglycosylation of STT3A-specific substrates in Case-1 fibroblasts. (A) A diagram of prosaposin showing the signal sequence (black), saposin domains (gray), glycosylation sites and disulfide bonds (black lines). (B) Control, CDG fibroblasts and HeLa cells were pulse labeled for 10 min with Tran-35S label. The HeLa cells were treated with negative control (NC) siRNA or siRNAs specific for STT3A or STT3B for 72 h prior to pulse-labeling. EH designates digestion with endoglycosidase H. Prosaposin glycoforms (0–5 glycans) were immunoprecipitated with anti-saposin (D) sera and resolved by SDS–PAGE. (C) HeLa cells were co-transfected with STT3A siRNA and STT3A-DDK-His tagged expression vectors as indicated. STT3A and STT3A-DDK-His expression was evaluated by immunoprecipitation of pulse-labeled STT3A as in Figure 2A (upper panel). Prosaposin glycoforms (0–5 glycans) were immunoprecipitated with anti-saposin D sera and resolved by SDS–PAGE as in Figure 4B (lower panel). The quantitation for average number of glycans in each lane is determined by adding the intensities of each band and allocating a percentage contribution to each band. (D) A diagram of granulin showing the signal sequence (black), granulin domains (gray), glycosylation sites, disulfide bonds (black lines) and an alternatively spliced product (Gran2) that lacks granulin domains (C and D). (E) The long (pGran-1) and short (pGran-2) forms of the granulin precursor were immunoprecipitated from cells pulse labeled for 10 min with Tran-35S label, using anti-granulin sera and resolved by SDS–PAGE. The pGran-1 glycoforms resolve poorly for unknown reasons.
Figure 5.
Hypoglycosylation of STT3B substrates in Case-2 fibroblasts. (A and C) Diagrams of sex hormone binding globulin (SHBG) (A) and β-GUSΔ123 (C) showing the N-terminal signal sequence, protease cleavage sites (arrowheads), free cysteine residues (black diamonds), disulfide bonds (black lines) and C-terminal glycosylation sites. (B and D) HeLa cells were treated with negative control (NC) siRNA or siRNAs specific for STT3A or STT3B as indicated for 48 h. Fibroblasts (control, Case-1 and Case-2) and siRNA treated HeLa cells were transfected with expression vectors for SHBG (B) or Myc-DDK tagged β-GUSΔ123 (D) 24 h before pulse-labeling for 10 min with Tran-35S label. (B) SHBG glycoforms (0–2 glycans) were immunoprecipitated with anti-SHBG sera and resolved by SDS–PAGE. (D) β-GUSΔ123 glycoforms (0 or 1 glycan) were immunoprecipitated with anti-DDK sera and resolved by SDS–PAGE. EH designates digestion with endoglycosidase H.
Similar articles
- Factor VIII and vWF deficiency in STT3A-CDG.
Chang IJ, Byers HM, Ng BG, Merritt JL 2nd, Gilmore R, Shrimal S, Wei W, Zhang Y, Blair AB, Freeze HH, Zhang B, Lam C. Chang IJ, et al. J Inherit Metab Dis. 2019 Mar;42(2):325-332. doi: 10.1002/jimd.12021. Epub 2019 Jan 30. J Inherit Metab Dis. 2019. PMID: 30701557 Free PMC article. - Mammalian STT3A/B oligosaccharyltransferases segregate N-glycosylation at the translocon from lipid-linked oligosaccharide hydrolysis.
Lu H, Fermaintt CS, Cherepanova NA, Gilmore R, Yan N, Lehrman MA. Lu H, et al. Proc Natl Acad Sci U S A. 2018 Sep 18;115(38):9557-9562. doi: 10.1073/pnas.1806034115. Epub 2018 Sep 4. Proc Natl Acad Sci U S A. 2018. PMID: 30181269 Free PMC article. - Construction of green fluorescence protein mutant to monitor STT3B-dependent N-glycosylation.
Kitajima T, Xue W, Liu YS, Wang CD, Liu SS, Fujita M, Gao XD. Kitajima T, et al. FEBS J. 2018 Mar;285(5):915-928. doi: 10.1111/febs.14375. Epub 2018 Jan 11. FEBS J. 2018. PMID: 29282902 - Structural Insight into the Mechanism of _N_-Linked Glycosylation by Oligosaccharyltransferase.
Mohanty S, Chaudhary BP, Zoetewey D. Mohanty S, et al. Biomolecules. 2020 Apr 17;10(4):624. doi: 10.3390/biom10040624. Biomolecules. 2020. PMID: 32316603 Free PMC article. Review. - Cotranslational and posttranslocational N-glycosylation of proteins in the endoplasmic reticulum.
Shrimal S, Cherepanova NA, Gilmore R. Shrimal S, et al. Semin Cell Dev Biol. 2015 May;41:71-8. doi: 10.1016/j.semcdb.2014.11.005. Epub 2014 Nov 24. Semin Cell Dev Biol. 2015. PMID: 25460543 Free PMC article. Review.
Cited by
- XMEN: welcome to the glycosphere.
Freeze HH. Freeze HH. J Clin Invest. 2020 Jan 2;130(1):80-82. doi: 10.1172/JCI134240. J Clin Invest. 2020. PMID: 31815737 Free PMC article. - Selective inhibition of N-linked glycosylation impairs receptor tyrosine kinase processing.
Klaver E, Zhao P, May M, Flanagan-Steet H, Freeze HH, Gilmore R, Wells L, Contessa J, Steet R. Klaver E, et al. Dis Model Mech. 2019 Jun 5;12(6):dmm039602. doi: 10.1242/dmm.039602. Dis Model Mech. 2019. PMID: 31101650 Free PMC article. - Factor VIII and vWF deficiency in STT3A-CDG.
Chang IJ, Byers HM, Ng BG, Merritt JL 2nd, Gilmore R, Shrimal S, Wei W, Zhang Y, Blair AB, Freeze HH, Zhang B, Lam C. Chang IJ, et al. J Inherit Metab Dis. 2019 Mar;42(2):325-332. doi: 10.1002/jimd.12021. Epub 2019 Jan 30. J Inherit Metab Dis. 2019. PMID: 30701557 Free PMC article. - Quantitative glycoproteomics reveals new classes of STT3A- and STT3B-dependent N-glycosylation sites.
Cherepanova NA, Venev SV, Leszyk JD, Shaffer SA, Gilmore R. Cherepanova NA, et al. J Cell Biol. 2019 Aug 5;218(8):2782-2796. doi: 10.1083/jcb.201904004. Epub 2019 Jul 11. J Cell Biol. 2019. PMID: 31296534 Free PMC article. - Congenital disorders of glycosylation: new defects and still counting.
Scott K, Gadomski T, Kozicz T, Morava E. Scott K, et al. J Inherit Metab Dis. 2014 Jul;37(4):609-17. doi: 10.1007/s10545-014-9720-9. Epub 2014 May 15. J Inherit Metab Dis. 2014. PMID: 24831587 Free PMC article. Review.
References
- Matthijs G., Rymen D., Millón M.B., Souche E., Race V. Approaches to homozygosity mapping and exome sequencing for the identification of novel types of CDG. Glycoconj. J. 2013;30:67–76. - PubMed
- Rosnoblet C., Peanne R., Legrand D., Foulquier F. Glycosylation disorders of membrane trafficking. Glycoconj. J. 2013;30:23–31. - PubMed
- Hennet T. Diseases of glycosylation beyond classical congenital disorders of glycosylation. Biochim. Biophys. Acta. 2012;1820:1306–1317. - PubMed
Publication types
MeSH terms
Substances
LinkOut - more resources
Full Text Sources
Other Literature Sources
Molecular Biology Databases


