Evidence for APOBEC3B mutagenesis in multiple human cancers - PubMed (original) (raw)
Evidence for APOBEC3B mutagenesis in multiple human cancers
Michael B Burns et al. Nat Genet. 2013 Sep.
Abstract
Thousands of somatic mutations accrue in most human cancers, and their causes are largely unknown. We recently showed that the DNA cytidine deaminase APOBEC3B accounts for up to half of the mutational load in breast carcinomas expressing this enzyme. Here we address whether APOBEC3B is broadly responsible for mutagenesis in multiple tumor types. We analyzed gene expression data and mutation patterns, distributions and loads for 19 different cancer types, with over 4,800 exomes and 1,000,000 somatic mutations. Notably, APOBEC3B is upregulated, and its preferred target sequence is frequently mutated and clustered in at least six distinct cancers: bladder, cervix, lung (adenocarcinoma and squamous cell carcinoma), head and neck, and breast. Interpreting these findings in the light of previous genetic, cellular and biochemical studies, the most parsimonious conclusion from these global analyses is that APOBEC3B-catalyzed genomic uracil lesions are responsible for a large proportion of both dispersed and clustered mutations in multiple distinct cancers.
Figures
Figure 1. APOBEC3B is upregulated in numerous cancer types
Each data point represents one tumor or normal sample, and the Y-axis is log-transformed for better data visualization. Red, blue, and yellow horizontal lines indicate the median APOBEC3B/TBP value for each cancer type (Table 1), the median value for each set of normal tissue RNAseq data (Supplementary Table 1), and individual RT-qPCR data points, respectively. Asterisks indicate significant upregulation of APOBEC3B in the indicated tumor type relative to the corresponding normal tissues (p<0.0001 by Mann-Whitney U-test). P-values for negative or insignificant associations are not shown.
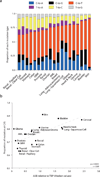
Figure 2. Mutation types and signatures in 19 human cancers
(a) Stacked bar graph summarizing the 6 types of base substitution mutations as proportions of the total mutations per cancer. (b) Median APOBEC3B relative to TBP expression levels plotted against the proportion of mutations at C/G base pairs (Spearman p = 0.0031, r = 0.64). Dashed grey line is the best-fit for visualization.
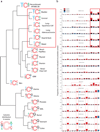
Figure 3. Cytosine mutation spectra for 19 cancers
(a) Dendrogram with weblogos indicating the relationship among cancer types determined by the trinucleotide contexts of mutations occurring at C nucleotides for the top 50% APOBEC3B expressing samples within each cancer type. Font size of the bases at the 5’ and 3’ positions are proportional to their observed occurrence in exome mutation datasets. The preferred mutation context for recombinant APOBEC3B from Ref. is included in the hierarchical clustering in order to determine how closely each cancers’ actual mutation spectrum matches the preferred motif for APOBEC3B in vitro. The pattern expected if the mutations were to occur at random C bases in the exome is included as an inset at the bottom left. (b) Stacked bars indicate the observed proportion of cytosine mutations at each unique trinucleotide [5’-N
C
N-to-N(
T/G/A
)N]. Bar color indicates each mutation type: red: C-to-T, black: C-to-G, and blue: C-to-A. The top 6 cancer types (highlighted by solid line box) show clear biases toward mutations within 5’TCN motifs, at frequencies that resemble the preferences of recombinant APOBEC3B in vitro (Ref. 33). Skin cancer and the bottom 7 cancers (highlighted by dashed line boxes) have obviously different cytosine mutation spectra.
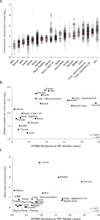
Figure 4. APOBEC3B expression levels correlate with total mutation loads and kataegis events
(a) A dot plot showing the total mutation loads for each tumor exome from each of the indicated cancers. Each data point represents one tumor, and the Y-axis is log-transformed for better visualization. A red horizontal line shows the median mutation load for each cancer type. (b) Median mutation loads per tumor exome for each cancer type plotted against the median APOBEC3B relative to TBP expression values (Spearman p = 0.0013, r = 0.68). Dashed grey line is the best-fit for visualization. (c) The mean number of cytosine mutation clusters per exome for each cancer type plotted against median APOBEC3B relative to TBP expression values (Spearman p = 0.0017, r = 0.54). Dashed grey line is the best-fit for visualization.
Comment in
- Genetics: APOBEC-a double-edged sword.
Razzak M. Razzak M. Nat Rev Clin Oncol. 2013 Sep;10(9):488. doi: 10.1038/nrclinonc.2013.138. Epub 2013 Jul 30. Nat Rev Clin Oncol. 2013. PMID: 23897082 No abstract available. - APOBEC3B mutagenesis in cancer.
Kuong KJ, Loeb LA. Kuong KJ, et al. Nat Genet. 2013 Sep;45(9):964-5. doi: 10.1038/ng.2736. Nat Genet. 2013. PMID: 23985681 Free PMC article. - Genomics: Mutator catalogues.
Alderton GK. Alderton GK. Nat Rev Cancer. 2013 Oct;13(10):681. doi: 10.1038/nrc3608. Nat Rev Cancer. 2013. PMID: 24060860 No abstract available.
Similar articles
- Human papillomavirus E6 triggers upregulation of the antiviral and cancer genomic DNA deaminase APOBEC3B.
Vieira VC, Leonard B, White EA, Starrett GJ, Temiz NA, Lorenz LD, Lee D, Soares MA, Lambert PF, Howley PM, Harris RS. Vieira VC, et al. mBio. 2014 Dec 23;5(6):e02234-14. doi: 10.1128/mBio.02234-14. mBio. 2014. PMID: 25538195 Free PMC article. - APOBEC3B is an enzymatic source of mutation in breast cancer.
Burns MB, Lackey L, Carpenter MA, Rathore A, Land AM, Leonard B, Refsland EW, Kotandeniya D, Tretyakova N, Nikas JB, Yee D, Temiz NA, Donohue DE, McDougle RM, Brown WL, Law EK, Harris RS. Burns MB, et al. Nature. 2013 Feb 21;494(7437):366-70. doi: 10.1038/nature11881. Epub 2013 Feb 6. Nature. 2013. PMID: 23389445 Free PMC article. - Integrative genomic analysis reveals functional diversification of APOBEC gene family in breast cancer.
Zhang Y, Delahanty R, Guo X, Zheng W, Long J. Zhang Y, et al. Hum Genomics. 2015 Dec 18;9:34. doi: 10.1186/s40246-015-0056-9. Hum Genomics. 2015. PMID: 26682542 Free PMC article. - Molecular mechanism and clinical impact of APOBEC3B-catalyzed mutagenesis in breast cancer.
Harris RS. Harris RS. Breast Cancer Res. 2015 Jan 21;17(1):8. doi: 10.1186/s13058-014-0498-3. Breast Cancer Res. 2015. PMID: 25848704 Free PMC article. Review. - [APOBEC3B-induced mutagenesis in cancers].
Takaori-Kondo A. Takaori-Kondo A. Seikagaku. 2016 Oct;88(5):576-81. Seikagaku. 2016. PMID: 29624320 Review. Japanese. No abstract available.
Cited by
- Apolipoprotein-B mRNA-editing complex 3B could be a new potential therapeutic target in endometriosis.
Vu TH, Nakamura K, Shigeyasu K, Kashino C, Okamoto K, Kubo K, Kamada Y, Masuyama H. Vu TH, et al. Sci Rep. 2024 Oct 23;14(1):24968. doi: 10.1038/s41598-024-76589-2. Sci Rep. 2024. PMID: 39443671 Free PMC article. - The Mechanism of APOBEC3B in Hepatitis B Virus Infection and HBV Related Hepatocellular Carcinoma Progression, Therapeutic and Prognostic Potential.
Yang X, Wang H, Yu C. Yang X, et al. Infect Drug Resist. 2024 Oct 17;17:4477-4486. doi: 10.2147/IDR.S484265. eCollection 2024. Infect Drug Resist. 2024. PMID: 39435460 Free PMC article. Review. - RADD: A real-time FRET-based biochemical assay for DNA deaminase studies.
Belica CA, Hernandez PC, Carpenter MA, Chen Y, Brown WL, Harris RS, Aihara H. Belica CA, et al. Methods Enzymol. 2024;705:311-345. doi: 10.1016/bs.mie.2024.08.001. Epub 2024 Aug 27. Methods Enzymol. 2024. PMID: 39389668 Free PMC article. - Characterisation of APOBEC3B-Mediated RNA editing in breast cancer cells reveals regulatory roles of NEAT1 and MALAT1 lncRNAs.
Zhang C, Lu YJ, Wang M, Chen B, Xiong F, Mitsopoulos C, Rossanese O, Li X, Clarke PA. Zhang C, et al. Oncogene. 2024 Nov;43(46):3366-3377. doi: 10.1038/s41388-024-03171-5. Epub 2024 Sep 25. Oncogene. 2024. PMID: 39322638 Free PMC article. - Integrated genomic/epigenomic analysis stratifies subtypes of clear cell ovarian carcinoma, highlighting their cellular origin.
Nishijima A, Oda K, Hasegawa K, Koso T, Asada K, Ikeda Y, Taguchi A, Maeda D, Nagae G, Tsuji S, Tatsuno K, Uehara Y, Kurosaki A, Sato S, Tanikawa M, Sone K, Mori M, Ikemura M, Fujiwara K, Ushiku T, Osuga Y, Aburatani H. Nishijima A, et al. Sci Rep. 2024 Aug 13;14(1):18797. doi: 10.1038/s41598-024-69796-4. Sci Rep. 2024. PMID: 39138354 Free PMC article.
References
- Stephens P, et al. A screen of the complete protein kinase gene family identifies diverse patterns of somatic mutations in human breast cancer. Nat Genet. 2005;37:590–592. - PubMed
- Sjöblom T, et al. The consensus coding sequences of human breast and colorectal cancers. Science. 2006;314:268–274. - PubMed
Publication types
MeSH terms
Substances
Grants and funding
- P01 GM091743/GM/NIGMS NIH HHS/United States
- R01 AI064046/AI/NIAID NIH HHS/United States
- T32 CA009138/CA/NCI NIH HHS/United States
- UL1 TR000114/TR/NCATS NIH HHS/United States
LinkOut - more resources
Full Text Sources
Other Literature Sources


