Meta-analyses of studies of the human microbiota - PubMed (original) (raw)
Meta-Analysis
. 2013 Oct;23(10):1704-14.
doi: 10.1101/gr.151803.112. Epub 2013 Jul 16.
Affiliations
- PMID: 23861384
- PMCID: PMC3787266
- DOI: 10.1101/gr.151803.112
Meta-Analysis
Meta-analyses of studies of the human microbiota
Catherine A Lozupone et al. Genome Res. 2013 Oct.
Abstract
Our body habitat-associated microbial communities are of intense research interest because of their influence on human health. Because many studies of the microbiota are based on the same bacterial 16S ribosomal RNA (rRNA) gene target, they can, in principle, be compared to determine the relative importance of different disease/physiologic/developmental states. However, differences in experimental protocols used may produce variation that outweighs biological differences. By comparing 16S rRNA gene sequences generated from diverse studies of the human microbiota using the QIIME database, we found that variation in composition of the microbiota across different body sites was consistently larger than technical variability across studies. However, samples from different studies of the Western adult fecal microbiota generally clustered by study, and the 16S rRNA target region, DNA extraction technique, and sequencing platform produced systematic biases in observed diversity that could obscure biologically meaningful compositional differences. In contrast, systematic compositional differences in the fecal microbiota that occurred with age and between Western and more agrarian cultures were great enough to outweigh technical variation. Furthermore, individuals with ileal Crohn's disease and in their third trimester of pregnancy often resembled infants from different studies more than controls from the same study, indicating parallel compositional attributes of these distinct developmental/physiological/disease states. Together, these results show that cross-study comparisons of human microbiota are valuable when the studied parameter has a large effect size, but studies of more subtle effects on the human microbiota require carefully selected control populations and standardized protocols.
Figures
Figure 1.
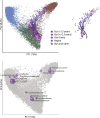
Unweighted UniFrac PCoA plot illustrating that samples from the human microbiome cluster primarily by body site. Each point represents a sample from one of the studies detailed in Table 1. Samples were classified broadly as from the Gut (mostly feces but also colon, ileum, and rectum), vagina, oral cavity (e.g., saliva, tongue, cheek), and skin and other (diverse skin sites, hair, nostril, and urine). Gut samples from individuals older than 2½ yr are colored brown and from individuals ages 0 to 2½ yr are colored across a dark purple (0 yr) to light purple (2½ yr) spectrum. Samples from one infant sampled repeatedly over the first 2½ yr of life are joined together with a purple line with a decreasingly dark hue with age. The infant samples are also shown in the inset. The most abundant bacterial families are superimposed on the same PCoA plot in the lower panel in purple. The size of the sphere representing a taxon is proportional to the mean relative abundance of the taxon across all samples.
Figure 2.
Unweighted UniFrac PCoA plots illustrating the relative degree to which age, cultural/geographic stratification, systematic differences in the collection of samples, and sequencing method affect the observed diversity of the gut microbiota. (A–C) Data from three different studies with age gradients from culturally diverse populations (Global_gut, US_infant_timeseries, and Italy/Burkina Faso) (Table 1). Points are colored by age gradient in A or by county in B. C plots the most abundant bacterial families as a weighted average of the coordinates of all samples in purple, where the weights are the relative abundances of the taxon in the samples. The size of the sphere representing a taxon is proportional to the mean relative abundance of the taxon across all samples.
Figure 3.
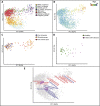
Unweighted UniFrac PCoA plots illustrating a strong study effect when comparing fecal samples of Western adults. (A) Studies conducted with Western adult populations. (B) Clustering of the fecal samples from IBD_twins (Table 1) colored by disease state. (ICD) Ileal Crohn's disease, (CCD) Colonic Crohn's Disease, (UC) Ulcerative Colitis. (C,D) Same as in A but with the axes rotated to maximize clustering by study. D shows just the bacterial orders as a weighted average of the coordinates of all samples, where the weights are the relative abundances of the taxon in the samples. The size of the sphere representing a taxon is proportional to the mean relative abundance of the taxon across all samples. Gram-positive bacterial orders are labeled in red text and Gram-negative in blue.
Figure 4.
Unweighted UniFrac PCoA plots illustrating the relationship between the bacterial diversity in fecal samples from different disease/physiologic states in adults and the infant microbiome. (A) Compares samples from same studies as in Figure 3A, but with the US_infant_timeseries, the US infants and children from Global_gut, and adults from a study of pregnancy (Pregnant_adults) (Table 1) added in addition. (A–D) The same plot, except that different subsets of the samples are shown or are colored differently. (A) Points colored by study. (B) Points colored by an age gradient. The samples from Pregnant_adults are not shown because the age of study participants was not available. (C) Samples from pregnant women in their first and third trimesters and 1 mo post-delivery (from Pregnant_adults) (Table 1) (D) Healthy individuals and individuals with ileal Crohn's disease from IBD_twins. (E) Bacterial families are plotted as a weighted average of the coordinates of all samples where the weights are the relative abundances of the taxon in the samples (purple circles). Gram-negative bacterial orders are in blue text, Gram-positive in red.
Similar articles
- Method for preparing DNA from feces in guanidine thiocyanate solution affects 16S rRNA-based profiling of human microbiota diversity.
Hosomi K, Ohno H, Murakami H, Natsume-Kitatani Y, Tanisawa K, Hirata S, Suzuki H, Nagatake T, Nishino T, Mizuguchi K, Miyachi M, Kunisawa J. Hosomi K, et al. Sci Rep. 2017 Jun 28;7(1):4339. doi: 10.1038/s41598-017-04511-0. Sci Rep. 2017. PMID: 28659635 Free PMC article. - Comparison of reduced metagenome and 16S rRNA gene sequencing for determination of genetic diversity and mother-child overlap of the gut associated microbiota.
Ravi A, Avershina E, Angell IL, Ludvigsen J, Manohar P, Padmanaban S, Nachimuthu R, Snipen L, Rudi K. Ravi A, et al. J Microbiol Methods. 2018 Jun;149:44-52. doi: 10.1016/j.mimet.2018.02.016. Epub 2018 Mar 1. J Microbiol Methods. 2018. PMID: 29501688 - Characterization of the fecal microbiota using high-throughput sequencing reveals a stable microbial community during storage.
Carroll IM, Ringel-Kulka T, Siddle JP, Klaenhammer TR, Ringel Y. Carroll IM, et al. PLoS One. 2012;7(10):e46953. doi: 10.1371/journal.pone.0046953. Epub 2012 Oct 5. PLoS One. 2012. PMID: 23071673 Free PMC article. - Metagenomic Analysis of Crohn's Disease Patients Identifies Changes in the Virome and Microbiome Related to Disease Status and Therapy, and Detects Potential Interactions and Biomarkers.
Pérez-Brocal V, García-López R, Nos P, Beltrán B, Moret I, Moya A. Pérez-Brocal V, et al. Inflamm Bowel Dis. 2015 Nov;21(11):2515-32. doi: 10.1097/MIB.0000000000000549. Inflamm Bowel Dis. 2015. PMID: 26313691 - Analyses of Intestinal Microbiota: Culture versus Sequencing.
Hiergeist A, Gläsner J, Reischl U, Gessner A. Hiergeist A, et al. ILAR J. 2015;56(2):228-40. doi: 10.1093/ilar/ilv017. ILAR J. 2015. PMID: 26323632 Review.
Cited by
- Microbiome meta-analysis and cross-disease comparison enabled by the SIAMCAT machine learning toolbox.
Wirbel J, Zych K, Essex M, Karcher N, Kartal E, Salazar G, Bork P, Sunagawa S, Zeller G. Wirbel J, et al. Genome Biol. 2021 Mar 30;22(1):93. doi: 10.1186/s13059-021-02306-1. Genome Biol. 2021. PMID: 33785070 Free PMC article. - Evaluating variation in human gut microbiota profiles due to DNA extraction method and inter-subject differences.
Wagner Mackenzie B, Waite DW, Taylor MW. Wagner Mackenzie B, et al. Front Microbiol. 2015 Feb 18;6:130. doi: 10.3389/fmicb.2015.00130. eCollection 2015. Front Microbiol. 2015. PMID: 25741335 Free PMC article. - Faecal Metaproteomic Analysis Reveals a Personalized and Stable Functional Microbiome and Limited Effects of a Probiotic Intervention in Adults.
Kolmeder CA, Salojärvi J, Ritari J, de Been M, Raes J, Falony G, Vieira-Silva S, Kekkonen RA, Corthals GL, Palva A, Salonen A, de Vos WM. Kolmeder CA, et al. PLoS One. 2016 Apr 12;11(4):e0153294. doi: 10.1371/journal.pone.0153294. eCollection 2016. PLoS One. 2016. PMID: 27070903 Free PMC article. Clinical Trial. - Integrity of the Human Faecal Microbiota following Long-Term Sample Storage.
Kia E, Wagner Mackenzie B, Middleton D, Lau A, Waite DW, Lewis G, Chan YK, Silvestre M, Cooper GJ, Poppitt SD, Taylor MW. Kia E, et al. PLoS One. 2016 Oct 4;11(10):e0163666. doi: 10.1371/journal.pone.0163666. eCollection 2016. PLoS One. 2016. PMID: 27701448 Free PMC article. - The Gut Microbiome and Bone Strength.
Castaneda M, Strong JM, Alabi DA, Hernandez CJ. Castaneda M, et al. Curr Osteoporos Rep. 2020 Dec;18(6):677-683. doi: 10.1007/s11914-020-00627-x. Epub 2020 Oct 8. Curr Osteoporos Rep. 2020. PMID: 33030683 Free PMC article. Review.
References
- Bove JM 1993. Molecular features of mollicutes. Clin Infect Dis (Suppl 1) 17: S10–S31 - PubMed
Publication types
MeSH terms
Substances
LinkOut - more resources
Full Text Sources
Other Literature Sources
Medical


