RNA sequencing of the human milk fat layer transcriptome reveals distinct gene expression profiles at three stages of lactation - PubMed (original) (raw)
RNA sequencing of the human milk fat layer transcriptome reveals distinct gene expression profiles at three stages of lactation
Danielle G Lemay et al. PLoS One. 2013.
Abstract
Aware of the important benefits of human milk, most U.S. women initiate breastfeeding but difficulties with milk supply lead some to quit earlier than intended. Yet, the contribution of maternal physiology to lactation difficulties remains poorly understood. Human milk fat globules, by enveloping cell contents during their secretion into milk, are a rich source of mammary cell RNA. Here, we pair this non-invasive mRNA source with RNA-sequencing to probe the milk fat layer transcriptome during three stages of lactation: colostral, transitional, and mature milk production. The resulting transcriptomes paint an exquisite portrait of human lactation. The resulting transcriptional profiles cluster not by postpartum day, but by milk Na:K ratio, indicating that women sampled during similar postpartum time frames could be at markedly different stages of gene expression. Each stage of lactation is characterized by a dynamic range (10(5)-fold) in transcript abundances not previously observed with microarray technology. We discovered that transcripts for isoferritins and cathepsins are strikingly abundant during colostrum production, highlighting the potential importance of these proteins for neonatal health. Two transcripts, encoding β-casein (CSN2) and α-lactalbumin (LALBA), make up 45% of the total pool of mRNA in mature lactation. Genes significantly expressed across all stages of lactation are associated with making, modifying, transporting, and packaging milk proteins. Stage-specific transcripts are associated with immune defense during the colostral stage, up-regulation of the machinery needed for milk protein synthesis during the transitional stage, and the production of lipids during mature lactation. We observed strong modulation of key genes involved in lactose synthesis and insulin signaling. In particular, protein tyrosine phosphatase, receptor type, F (PTPRF) may serve as a biomarker linking insulin resistance with insufficient milk supply. This study provides the methodology and reference data set to enable future targeted research on the physiological contributors of sub-optimal lactation in humans.
Conflict of interest statement
Competing Interests: The authors have declared that no competing interests exist.
Figures
Figure 1. Relative mRNA abundances in the milk fat layer during mature lactation.
Each pie slice represents the proportion of the total mRNA pool attributed to expression of the labeled gene. The pie slice representing the most abundant transcript occurs at the 3′o-clock position with subsequent transcripts presented counter-clockwise in decreasing order of abundance; mRNAs from the most abundant human milk proteins–CSN2 and LALBA–are ranked highest, consistent with known mammary gland biology. Inset: For direct comparison, we used the same approach to examine the top 500 expressed genes in the milk fat layer during mature lactation from a microarray array experiment ; note the markedly narrower range in relative abundances. CSN2 is ranked 18th in the microarray experiment.
Figure 2. Relative mRNA abundances in the milk fat layer during transitional lactation.
Each pie slice represents the proportion of the total mRNA pool attributed to expression of the labeled gene during transitional lactation. For direct comparison to Figure 1, the pie slice representing the most abundant transcript in the Mature transcriptome (Figure 1) is placed at the 3′o-clock position, with subsequent transcripts presented counterclockwise according to decreasing order in Figure 1. The color of the pie slice for any individual transcript is also consistent with Figure 1.
Figure 3. Relative mRNA abundances in the milk fat layer during the colostral stage of lactation.
Each pie slice represents the proportion of the total mRNA pool attributed to expression of the labeled gene during the colostral stage. For direct comparison to Figure 1, the pie slice representing the most abundant transcript in the Mature transcriptome (Figure 1) is placed at the 3′o-clock position, with subsequent transcripts presented counterclockwise according to decreasing order in Figure 1. The color of the pie slice for any individual transcript is also consistent with Figure 1.
Figure 4. Enrichment of functional annotations for top 10% of expressing genes by stage of lactation.
During all stages of lactation, protein synthesis is a significant biological function of highly expressed genes. Immune defense is a hallmark of the colostral stage. The development of the protein synthesis infrastructure and inhibition of protein degradation begins during the transitional stage. Massive lipid synthesis is a hallmark of the mature stage.
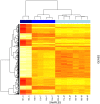
Figure 5. Heat map of differentially expressed genes between all stages of lactation.
Columns are clustered by sample and rows are clustered by gene. Dendogram height indicates distances between clusters in gene expression profiles. The heat map illustrates lower (white/yellow) to higher (orange/red) gene expression levels with distinct transcriptional profiles across lactation stages. Blue bars at the top of each column indicate lactation stage: dark blue = colostral; blue = transitional; and light blue = mature. From left to right, starting with ID 187, postpartum timing of sample collections are 41, 52, 52, 39, 56, and 49 hours; and 130, 33, 35, 40, 24, and 45 days. Similarly, starting with ID 187, Na:K ratios are 9.6, 5.5, 0.71, 0.70, 0.98, 1.15, 0.19, 0.30, 0.57, 0.41, 0.33, and 0.45.
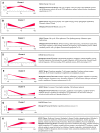
Figure 6. Cluster trajectories and functional enrichment across stages of lactation.
Panels A-H: Each X-axis indicates the lactation state (colostrum, transitional, mature); Y-axis shows expression changes. Trajectory clustering analyses (see Methods) show that gene expression does not steadily increase or decrease in the progression from colostral to mature lactation. Eight clusters (Panels A-H) represent the major transcriptional trajectories. To the right of each cluster are shown the statistically enriched KEGG pathways and the top 10 significantly enriched biologic process GO terms (n = total number of significantly enriched biologic processes).
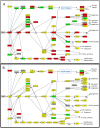
Figure 7. Relative expression of genes encoding proteins in the KEGG Insulin Signaling pathway.
Panel A: Strong up-regulation of genes encoding insulin signaling proteins occurs between colostral and transitional stages; Panel B: signaling is attenuated between transitional and mature stages. Panels A-B: Gene symbols are detailed in Dataset S4. Color denotes change in gene expression from colostrum to transitional (Panel A) or transitional to mature (Panel B): red = significant increase, green = significant decrease, and yellow = no significant change in expression between stages; gray = no member of this gene family is expressed >0.5 FPKM during either stage being compared. Differences with p<0.05 after adjustment for multiple hypothesis testing (method = “BH”) were deemed statistically significant. Symbols: ↓ activation; ⊥ inhibition; –>indirect effect. Full symbol key at
http://www.genome.jp/kegg/document/help\_pathway.html
.
Figure 8. Relative expression of genes encoding enzymes in the lactose synthesis pathway.
The rate of lactose synthesis is an important driver of milk production level. Panel A: Strong up-regulation of genes encoding lactose synthesis enzymes occurs between colostral and transitional stages; Panel B: UDP-Glucose production (PGM) is attenuated between transitional and mature stages. Notably, this occurs while LALBA continues to increase in expression. Panels A-B: Gene symbols are detailed in Dataset S4. Color denotes change in gene expression from colostrum to transitional (Panel A) or transitional to mature (Panel B): red = significant increase; green = significant decrease; and yellow = no significant change in gene express levels between stages. Differences with p<0.05 after adjustment for multiple hypothesis testing (method = “BH”) were deemed statistically significant. Footnotes: ***** more than one member of this gene family is expressed >0.5 FPKM; – Alternate pathway for producing UDP-Galactose; SLC–?, specific family member that translocates D-Galactose is not known.
Figure 9. Confirmation of RNA-Seq results with qPCR results.
Data derived from average of 4 milk fat layer samples obtained during mature lactation. Results are plotted on a log scale for both axes. X-axis: qPCR ΔCt (target gene, cycle threshold - geometric mean of endogenous genes, cycle threshold); Y-axis: RNA-seq FPKM (target gene FPKM/geometric mean of endogenous genes FPKM). Endogenous genes selected: ACTB, RPS18, SSH3. Correlation of gene expression measured by qPCR versus RNA-seq, R2 = 0.98, p<0.001.
Similar articles
- RNA-Sequencing for profiling goat milk transcriptome in colostrum and mature milk.
Crisà A, Ferrè F, Chillemi G, Moioli B. Crisà A, et al. BMC Vet Res. 2016 Nov 25;12(1):264. doi: 10.1186/s12917-016-0881-7. BMC Vet Res. 2016. PMID: 27884183 Free PMC article. - Changes in the milk composition of nonpuerperal women.
Kulski JK, Hartmann PE, Saint WJ, Giles PF, Gutteridge DH. Kulski JK, et al. Am J Obstet Gynecol. 1981 Mar 1;139(5):597-604. doi: 10.1016/0002-9378(81)90523-8. Am J Obstet Gynecol. 1981. PMID: 7193419 - Transcriptome profiling of microRNA by Next-Gen deep sequencing reveals known and novel miRNA species in the lipid fraction of human breast milk.
Munch EM, Harris RA, Mohammad M, Benham AL, Pejerrey SM, Showalter L, Hu M, Shope CD, Maningat PD, Gunaratne PH, Haymond M, Aagaard K. Munch EM, et al. PLoS One. 2013;8(2):e50564. doi: 10.1371/journal.pone.0050564. Epub 2013 Feb 13. PLoS One. 2013. PMID: 23418415 Free PMC article. - The composition of human milk.
Jenness R. Jenness R. Semin Perinatol. 1979 Jul;3(3):225-39. Semin Perinatol. 1979. PMID: 392766 Review. - A Comparative Review of the Cell Biology, Biochemistry, and Genetics of Lactose Synthesis.
Sadovnikova A, Garcia SC, Hovey RC. Sadovnikova A, et al. J Mammary Gland Biol Neoplasia. 2021 Jun;26(2):181-196. doi: 10.1007/s10911-021-09490-7. Epub 2021 Jun 14. J Mammary Gland Biol Neoplasia. 2021. PMID: 34125364 Free PMC article. Review.
Cited by
- Transcriptomic changes underlying glucocorticoid-induced suppression of milk production by dairy cows.
Sadovnikova A, Garcia SC, Trott JF, Mathews AT, Britton MT, Durbin-Johnson BP, Hovey RC. Sadovnikova A, et al. Front Genet. 2022 Dec 6;13:1072853. doi: 10.3389/fgene.2022.1072853. eCollection 2022. Front Genet. 2022. PMID: 36561310 Free PMC article. - Antiviral properties of whey proteins and their activity against SARS-CoV-2 infection.
Gallo V, Giansanti F, Arienzo A, Antonini G. Gallo V, et al. J Funct Foods. 2022 Feb;89:104932. doi: 10.1016/j.jff.2022.104932. Epub 2022 Jan 4. J Funct Foods. 2022. PMID: 35003332 Free PMC article. Review. - Multi-population GWAS and enrichment analyses reveal novel genomic regions and promising candidate genes underlying bovine milk fatty acid composition.
Gebreyesus G, Buitenhuis AJ, Poulsen NA, Visker MHPW, Zhang Q, van Valenberg HJF, Sun D, Bovenhuis H. Gebreyesus G, et al. BMC Genomics. 2019 Mar 6;20(1):178. doi: 10.1186/s12864-019-5573-9. BMC Genomics. 2019. PMID: 30841852 Free PMC article. - A Case Control Study of Diabetes During Pregnancy and Low Milk Supply.
Riddle SW, Nommsen-Rivers LA. Riddle SW, et al. Breastfeed Med. 2016 Mar;11(2):80-5. doi: 10.1089/bfm.2015.0120. Epub 2016 Feb 9. Breastfeed Med. 2016. PMID: 26859784 Free PMC article.
References
- Ip S, Chung M, Raman G, Chew P, Magula N, et al. (2007) Breastfeeding and maternal and infant health outcomes in developed countries. Agency for Healthcare Research and Quality. - PubMed
- Hauck FR, Thompson JM, Tanabe KO, Moon RY, Vennemann MM (2011) Breastfeeding and reduced risk of sudden infant death syndrome: a meta-analysis. Pediatrics 128: 103–110. - PubMed
- Gunderson EP, Jacobs DR Jr, Chiang V, Lewis CE, Feng J, et al. (2010) Duration of lactation and incidence of the metabolic syndrome in women of reproductive age according to gestational diabetes mellitus status: a 20-Year prospective study in CARDIA (Coronary Artery Risk Development in Young Adults). Diabetes 59: 495–504. - PMC - PubMed
- US Department of Health and Human Services (2011) The Surgeon General’s Call to Action to Support Breastfeeding. Washington, DC: Office of the Surgeon General.
- Institute of Medicine Committee on Obesity Prevention Policies for Young Children (2011) Early Childhood Obesity Prevention Policies: Goals, Recommendations, and Potential Actions. Washington, D.C.: Institute of Medicine.
Publication types
MeSH terms
Substances
Grants and funding
- P01 HD013021/HD/NICHD NIH HHS/United States
- P51RR000169-49S1/RR/NCRR NIH HHS/United States
- 8 UL1 TR000077-04/TR/NCATS NIH HHS/United States
- UL1 TR000077/TR/NCATS NIH HHS/United States
- HD13021/HD/NICHD NIH HHS/United States
- P51 RR000169/RR/NCRR NIH HHS/United States
LinkOut - more resources
Full Text Sources
Other Literature Sources
Molecular Biology Databases
Miscellaneous


