Developmental differences in IFN signaling affect GATA1s-induced megakaryocyte hyperproliferation - PubMed (original) (raw)
. 2013 Jul 1;123(8):3292-3304.
doi: 10.1172/JCI40609. Online ahead of print.
- PMID: 23863621
- PMCID: PMC3726146
- DOI: 10.1172/JCI40609
Developmental differences in IFN signaling affect GATA1s-induced megakaryocyte hyperproliferation
Andrew J Woo et al. J Clin Invest. 2013.
Abstract
About 10% of Down syndrome (DS) infants are born with a transient myeloproliferative disorder (DS-TMD) that spontaneously resolves within the first few months of life. About 20%-30% of these infants subsequently develop acute megakaryoblastic leukemia (DS-AMKL). Somatic mutations leading to the exclusive production of a short GATA1 isoform (GATA1s) occur in all cases of DS-TMD and DS-AMKL. Mice engineered to exclusively produce GATA1s have marked megakaryocytic progenitor (MkP) hyperproliferation during early fetal liver (FL) hematopoiesis, but not during postnatal BM hematopoiesis, mirroring the spontaneous resolution of DS-TMD. The mechanisms that underlie these developmental stage-specific effects are incompletely understood. Here, we report a striking upregulation of type I IFN-responsive gene expression in prospectively isolated mouse BM- versus FL-derived MkPs. Exogenous IFN-α markedly reduced the hyperproliferation FL-derived MkPs of GATA1s mice in vitro. Conversely, deletion of the α/β IFN receptor 1 (Ifnar1) gene or injection of neutralizing IFN-α/β antibodies increased the proliferation of BM-derived MkPs of GATA1s mice beyond the initial postnatal period. We also found that these differences existed in human FL versus BM megakaryocytes and that primary DS-TMD cells expressed type I IFN-responsive genes. We propose that increased type I IFN signaling contributes to the developmental stage-specific effects of GATA1s and possibly the spontaneous resolution of DS-TMD.
Figures
Figure 1. Flow cytometric sorting of MkPs from adult BM and E13.5 FL.
(A and B) FACS plots and gates used for cell sorting. Cells were stained with antibodies against lineage markers, c-KIT, Sca-1, CD41, and CD150. Dead cells were identified by staining with DAPI and were excluded. May-Grünwald-Giemsa stains of cytospun freshly sorted BM and FL MkPs are also shown (original magnification, ×1,000). (A) Percent BM-MkPs gated relative to the starting population was as follows: P3, 17%; P4, 16.5%; P5, 1.9%. (B) Percent FL-MkPs gated relative to the starting population was as follows: P3, 38.2%; P4, 24.4%; P5, 1.2%. (C) Colony-forming assays. Percentage of colony type from sorted or unsorted BM and FL cells cultured in semisolid medium (after red blood cell lysis) containing TPO, erythropoietin, stem cell factor, IL-3, IL-11, and GM-CSF. Colonies were enumerated after 8 days. Cell accumulations of 3 or more cells were considered a colony. (D) Representative Mk colonies (unstained) from BM (day 7 of culture) or FL (day 8 of culture). Original magnification, ×100.
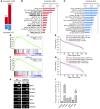
Figure 2. Gene expression analysis of FL-MkPs versus BM-MkPs.
(A) Total number of genes whose expression changed >4-fold with P < 0.05 among the 3 biologic replicates and were represented by probes on the array comparing FL-MkPs versus BM-MkPs for male WT and GATA1s mice. (B and C) Analysis of gene sets enriched in BM-MkPs relative to FL-MkPs and vice versa from WT mice. Asterisks and bold type denote IFN-α–responsive gene sets. (D and F) GSEA for the combined set of 92 IFN-α–induced genes (Supplemental Table 3 and refs. 44, 45) compared with the differentially expressed genes in BM-MkPs versus FL-MkPs in WT (D) and GATA1s (F) mice. (E and G) Probe set intensities corresponding to each of the 92 genes, compared with intensities of 164 randomly selected probe sets, arranged from highest to lowest from the FL-MkP and BM-MkP datasets in WT (E) and GATA1s (G) mice. (H and I) Validation of differences in IFN-α–responsive gene expression in FL-MkPs versus BM-MkPs by conventional PCR (H) and qRT-PCR (I). Some lanes in H were run on different gels or noncontiguous lanes of the same gel.
Figure 3. Increased protein levels of type I IFN–responsive genes in BM versus FL Mks.
(A) In situ immunohistochemical staining for IRF1 and IFI205 in adult femur BM and E13.5 FL of WT mice. Staining for vWF served as a positive control for Mks. Positive staining appears brown; counterstain is blue. Arrows indicate Mks. See also Supplemental Figure 3. (B) In situ immunohistochemical staining for IRF1 and IRF8 in GATA1s male mice. Staining for vWF is indicated as a positive control. See also Supplemental Figure 4. Scale bars: 5 μm.
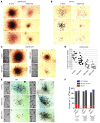
Figure 4. Antiproliferative activity of IFN-α on GATA1s-containing E13.5 FL Mks.
(A and B) Representative CFU-Mk colony morphologies from male GATA1s or WT E13.5 FL cultured with 5 ng/ml TPO and 0 or 1,000 U/ml recombinant murine IFN-α. Colonies were fixed and stained for AChE activity after 7 (GATA1s) or 8 (WT) days. Original magnification, ×40. (C) AChE stained CFU-Mk colonies generated from male GATA1s E13.5 FL cultured with 5 ng/ml TPO and 0, 100, 500, or 1,000 U/ml recombinant IFN-α. Original magnification, ×40. Images of the entire slides are shown at left. (D) Effect of IFN-α treatment on CFU-Mk colony size from GATA1s E13.5 FL cultured in the presence of 5 ng/ml TPO and the indicated concentrations of IFN-α. Colony size is given as the number of pixels encompassing the entire colony after photographing the culture dishes (see Methods). Horizontal bars denote means. (E) Relative lineage-selective effects of IFN-α on Mk growth. Shown are representative BM AChE-stained CFU-Mk colonies from WT or Ifnar1–/– mice cultured in the presence of 5 ng/ml TPO and the indicated IFN-α concentrations. Original magnification, ×40. Images of the entire slides are shown at left. (F) Quantitation of BFU-E, CFU-GM, and CFU-GEMM of separate cultures grown in MethoCult (Stem Cell Technologies) semisolid medium containing SCF (50 ng/ml), IL-3 (10 ng/ml), IL-6 (10 ng/ml), EPO (3 IU/ml), insulin (10 μg/ml), transferrin (200 μg/ml), and the indicated IFN-α concentrations. See also Supplemental Figure 5.
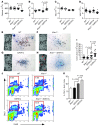
Figure 5. Enhanced postnatal proliferation of GATA1s-containing Mks in an Ifnar1–/– genetic background.
(A–D) Peripheral blood platelet count (A), mean platelet volume (B), red blood cell count (C), and white blood cell count (D) of WT (C57BL/6), Ifnar1–/–, GATA1s, and Ifnar1–/–::GATA1s male mice at 3–4 weeks of age. (E–H) Representative AChE-stained BM CFU-Mk colonies from each mouse genotype at 3–4 weeks of age. Original magnification, ×40. Images of the entire slides are shown at left. Red arrows in H indicate hyperplastic colonies. (I) Quantitation of colony size (mean number of pixels covered by colonies derived from photographs) from 20 randomly selected colonies. (J) Representative flow cytometry plots for BrdU and 7AAD (DNA content stain) of CD41+ gated cells obtained from the BM of 3- to 4-week-old mice of the indicated genotypes. (K) Percent CD41+BrdU+ cells from J (n = 3).
Figure 6. Expansion of BM Mks in GATA1s mice injected with neutralizing IFN-α/β antibodies.
(A) Experimental scheme. 4- to 6-week-old GATA1s or age-matched WT mice were injected intraperitoneally with 1 × 10⁴ neutralizing units of anti–IFN-α and anti–IFN-β antibodies each, or an equivalent amount of normal rabbit IgG. 8 days after injection, animals were euthanized, and BM was harvested. (B) Flow cytometric color-contour plots for CD41 staining and forward scatter from whole BM (after red blood cell lysis) from 1 representative experiment. (C) Change in CD41+ cell frequency in mice injected with neutralizing IFN-α/β antibodies versus control IgG (n = 3). Results of 3 independent experiments are shown. (D) Representative vWF immunohistochemical stained sections of femur BM from mice injected 8 days earlier with neutralizing anti–IFN-α/β antibodies or equivalent amounts of control IgG. Scale bar: 1 mm. (E) Quantitation of the data in D, showing the mean number of Mks per 2-mm2 field in 10 randomly selected sections.
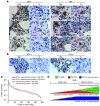
Figure 7. Developmental stage–specific difference in human Mk IFN-α–responsive gene expression.
(A) In situ immunohistochemical staining for IRF1 and vWF in FL from 12- to 22-week estimated gestational age aborted human fetuses and from BM of >1-year-old individuals. Arrows indicate Mks. Original magnification, ×1,000. See also Supplemental Figure 6. (B) In situ immunohistochemical staining for IFN-α and IFN-β of human FL and BM as in A. Arrows indicate positive cells. Original magnification, ×1,000. See also Supplemental Figure 7. (C) Expression of IFN-α–responsive genes in human DS-TMD and DS-AMKL cells (based on data in ref. 6) compared with an equivalent number of randomly selected probes, shown in rank order. (D) Model for developmental stage–specific reduction in GATA1s-related Mk hyperproliferation with increases in IFN-α/β–responsive gene expression.
Similar articles
- The abundance of the short GATA1 isoform affects megakaryocyte differentiation and leukemic predisposition in mice.
Ishihara D, Hasegawa A, Hirano I, Engel JD, Yamamoto M, Shimizu R. Ishihara D, et al. Exp Hematol Oncol. 2024 Feb 26;13(1):24. doi: 10.1186/s40164-024-00492-9. Exp Hematol Oncol. 2024. PMID: 38409186 Free PMC article. - Developmental stage-selective effect of somatically mutated leukemogenic transcription factor GATA1.
Li Z, Godinho FJ, Klusmann JH, Garriga-Canut M, Yu C, Orkin SH. Li Z, et al. Nat Genet. 2005 Jun;37(6):613-9. doi: 10.1038/ng1566. Epub 2005 May 15. Nat Genet. 2005. PMID: 15895080 - Mutations in exon 2 of GATA1 are early events in megakaryocytic malignancies associated with trisomy 21.
Rainis L, Bercovich D, Strehl S, Teigler-Schlegel A, Stark B, Trka J, Amariglio N, Biondi A, Muler I, Rechavi G, Kempski H, Haas OA, Izraeli S. Rainis L, et al. Blood. 2003 Aug 1;102(3):981-6. doi: 10.1182/blood-2002-11-3599. Epub 2003 Mar 20. Blood. 2003. PMID: 12649131 - Acute megakaryoblastic leukaemia (AMKL) and transient myeloproliferative disorder (TMD) in Down syndrome: a multi-step model of myeloid leukaemogenesis.
Roy A, Roberts I, Norton A, Vyas P. Roy A, et al. Br J Haematol. 2009 Oct;147(1):3-12. doi: 10.1111/j.1365-2141.2009.07789.x. Epub 2009 Jul 6. Br J Haematol. 2009. PMID: 19594743 Review. - Acute megakaryoblastic leukemia in Down syndrome.
Hitzler JK. Hitzler JK. Pediatr Blood Cancer. 2007 Dec;49(7 Suppl):1066-9. doi: 10.1002/pbc.21353. Pediatr Blood Cancer. 2007. PMID: 17943965 Review.
Cited by
- Layered immunity and layered leukemogenicity: Developmentally restricted mechanisms of pediatric leukemia initiation.
Mendoza-Castrejon J, Magee JA. Mendoza-Castrejon J, et al. Immunol Rev. 2023 May;315(1):197-215. doi: 10.1111/imr.13180. Epub 2023 Jan 2. Immunol Rev. 2023. PMID: 36588481 Free PMC article. Review. - Oncogenic Gata1 causes stage-specific megakaryocyte differentiation delay.
Juban G, Sakakini N, Chagraoui H, Cruz Hernandez D, Cheng Q, Soady K, Stoilova B, Garnett C, Waithe D, Otto G, Doondeea J, Usukhbayar B, Karkoulia E, Alexiou M, Strouboulis J, Morrissey E, Roberts I, Porcher C, Vyas P. Juban G, et al. Haematologica. 2021 Apr 1;106(4):1106-1119. doi: 10.3324/haematol.2019.244541. Haematologica. 2021. PMID: 32527952 Free PMC article. - The role of the haematopoietic stem cell niche in development and ageing.
Cain TL, Derecka M, McKinney-Freeman S. Cain TL, et al. Nat Rev Mol Cell Biol. 2025 Jan;26(1):32-50. doi: 10.1038/s41580-024-00770-8. Epub 2024 Sep 10. Nat Rev Mol Cell Biol. 2025. PMID: 39256623 Review. - Involvement of GATA1 and Sp3 in the activation of the murine STING gene promoter in NIH3T3 cells.
Xu YY, Jin R, Zhou GP, Xu HG. Xu YY, et al. Sci Rep. 2017 May 18;7(1):2090. doi: 10.1038/s41598-017-02242-w. Sci Rep. 2017. PMID: 28522827 Free PMC article. - Genome-wide Association Study of Platelet Count Identifies Ancestry-Specific Loci in Hispanic/Latino Americans.
Schick UM, Jain D, Hodonsky CJ, Morrison JV, Davis JP, Brown L, Sofer T, Conomos MP, Schurmann C, McHugh CP, Nelson SC, Vadlamudi S, Stilp A, Plantinga A, Baier L, Bien SA, Gogarten SM, Laurie CA, Taylor KD, Liu Y, Auer PL, Franceschini N, Szpiro A, Rice K, Kerr KF, Rotter JI, Hanson RL, Papanicolaou G, Rich SS, Loos RJ, Browning BL, Browning SR, Weir BS, Laurie CC, Mohlke KL, North KE, Thornton TA, Reiner AP. Schick UM, et al. Am J Hum Genet. 2016 Feb 4;98(2):229-42. doi: 10.1016/j.ajhg.2015.12.003. Epub 2016 Jan 21. Am J Hum Genet. 2016. PMID: 26805783 Free PMC article.
References
- Zipursky A, Brown EJ, Christensen H, Doyle J. Transient myeloproliferative disorder (transient leukemia) and hematologic manifestations of Down syndrome. Clin Lab Med. 1999;19(1):157–167, vii. - PubMed
- Langebrake C, Creutzig U, Reinhardt D. Immunophenotype of Down syndrome acute myeloid leukemia and transient myeloproliferative disease differs significantly from other diseases with morphologically identical or similar blasts. Klin Padiatr. 2005;217(3):126–134. doi: 10.1055/s-2005-836510. - DOI - PubMed
LinkOut - more resources
Full Text Sources
Other Literature Sources
Molecular Biology Databases


