Large-scale gene function analysis with the PANTHER classification system - PubMed (original) (raw)
Large-scale gene function analysis with the PANTHER classification system
Huaiyu Mi et al. Nat Protoc. 2013 Aug.
Abstract
The PANTHER (protein annotation through evolutionary relationship) classification system (http://www.pantherdb.org/) is a comprehensive system that combines gene function, ontology, pathways and statistical analysis tools that enable biologists to analyze large-scale, genome-wide data from sequencing, proteomics or gene expression experiments. The system is built with 82 complete genomes organized into gene families and subfamilies, and their evolutionary relationships are captured in phylogenetic trees, multiple sequence alignments and statistical models (hidden Markov models or HMMs). Genes are classified according to their function in several different ways: families and subfamilies are annotated with ontology terms (Gene Ontology (GO) and PANTHER protein class), and sequences are assigned to PANTHER pathways. The PANTHER website includes a suite of tools that enable users to browse and query gene functions, and to analyze large-scale experimental data with a number of statistical tests. It is widely used by bench scientists, bioinformaticians, computer scientists and systems biologists. In the 2013 release of PANTHER (v.8.0), in addition to an update of the data content, we redesigned the website interface to improve both user experience and the system's analytical capability. This protocol provides a detailed description of how to analyze genome-wide experimental data with the PANTHER classification system.
Conflict of interest statement
Competing financial interests
The authors declare that they have no competing financial interests.
Figures
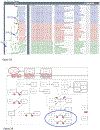
Figure 1. Overview of PANTHER infrastructure.
PANTHER is consisted of three modules. The core module is the PANTHER protein library (yellow shade) that contains a collection of PANTHER families and subfamilies, each of which is represented by a phylogenetic tree, an MSA and an HMM. The second module is the pathway that contains 176 expert-curated pathways (green shade). The pathway components are associated to the protein sequences that are used to build the protein library (the light green shade), and therefore, the pathways are also linked to the subfamilies and HMMs. The third module is the tool suite. In this diagram, the gene list analysis tool is used as an example (blue shade). When the user uploads a gene list to the tool, and if the IDs in the list are from one of 82 organisms in PANTHER, the tool will map the IDs to the IDs in the PANTHER protein library (green arrows). If the uploaded IDs are not from one of the 82 organisms, the user can score the sequences against the PANTHER HMM library and generate the PANTHER Generic Mapping file (see Box 2) (orange arrows). There are three tests in the tool: functional classification, statistical overrepresentation test and statistical enrichment test. Numeric values must be provided in order to use the statistical enrichment test.
Figure 2. Examples of PANTHER phylogenetic tree and pathway diagram
(A) A sample phylogenetic tree from PANTHER (PTHR11633, PLATELET-DERIVED GROWTH FACTOR). The family contains three subfamilies (blue arrows). SF1 is annotated as “PDGF/VEGF growth factor related protein 1” based on the annotation in the drosophila and c. elegans sequences (Q9VWP6 and Q9N143, respectively). There is a recent duplication that generates the PDGF A chain (SF3) and the PDGF B chain (SF2). Ontology terms are annotated to the node that represents the common ancestor if the extant family, in this case, AN0 (SF1). The classifications are propagated to all the descent nodes, including the AN4 (SF3) and AN33 (SF2). (B) An example of PANTHER pathway diagram (P00047, PDGF signaling pathway). The diagram is shown in CellDesigner process diagram, which is similar to the SBGN-PD format, for example (blue circle), a transition of an input (e.g., ERK) to an output (eg., phosphorylated ERK) catalyzed by a modifier (eg., phosphorylated MEK). A pathway component (e.g, PDGF in red circle) is associated with the protein sequences in the protein library (red arrows in 2A) through expert curation. This association is supported by literature evidence. As a result, the pathway component of PDGF can be inferred to other orthologous protein sequences in the subfamilies in the library (SF2 and SF3 in 2A).
Figure 3
The PANTHER home page with the Gene List Analysis Tools.
Figure 4
User interface of the statistical overrepresentation test to allow user to select additional test gene lists.
Figure 5
Results of functional classification displayed as a gene list page. The results are based on the sampleTestList_NP_500 file in the Supplemental Materials.
Figure 6
PANTHER pie chart results from the sampleTestList_NP_500 file in the Supplemental Materials. You can use the Select ontology drop-down menu to switch to the pie chart of different ontologies. Click on the pie chart section to display the child categories. Click on the legends on the right side to retrieve the list of the genes for that category.
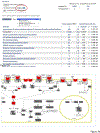
Figure 7. Result from the statistical overrepresentation test. The results are based on the sampleTestList_NP_500 file in the Supplemental Materials.
(A) The summary of the results is displayed in a table. You can export the table in a tab-delimited file by clicking the Export results button. You can also view the results in other views by using the View drop-down menu. If your analysis is done in pathway as shown here, you can click the pathway name and display the pathway diagram. The pathway components that have genes in your test list will be highlighted. The color of the highlighted component can be defined at the top of the page (red circle). A total of 4 test lists can be analyzed and viewed at the same time. (B) The results viewed in the PANTHER pathway Heterotrimeric G-protein signaling pathway – Gi alpha and Gs alpha mediated pathway (P00026). The components that contain the genes in the test gene list are highlighted in red.
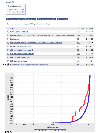
Figure 8.
The results from the statistical enrichment test. The results are based on the sampleTestList_NP file in the Supplemental Materials. (A) The output of the tool with a list of P-values for each comparison between a functional category distribution and the reference distribution. (B) Comparison of the distributions from PDGF signaling pathway (red) and reference (blue) in graph view. (C) A pathway diagram of PDGF signaling pathway that is visualized using an interactive pathway Java applet that colors the pathway using a “heat map” derived from the input values.
Similar articles
- Protocol Update for large-scale genome and gene function analysis with the PANTHER classification system (v.14.0).
Mi H, Muruganujan A, Huang X, Ebert D, Mills C, Guo X, Thomas PD. Mi H, et al. Nat Protoc. 2019 Mar;14(3):703-721. doi: 10.1038/s41596-019-0128-8. Epub 2019 Feb 25. Nat Protoc. 2019. PMID: 30804569 Free PMC article. - PANTHER version 10: expanded protein families and functions, and analysis tools.
Mi H, Poudel S, Muruganujan A, Casagrande JT, Thomas PD. Mi H, et al. Nucleic Acids Res. 2016 Jan 4;44(D1):D336-42. doi: 10.1093/nar/gkv1194. Epub 2015 Nov 17. Nucleic Acids Res. 2016. PMID: 26578592 Free PMC article. - PANTHER in 2013: modeling the evolution of gene function, and other gene attributes, in the context of phylogenetic trees.
Mi H, Muruganujan A, Thomas PD. Mi H, et al. Nucleic Acids Res. 2013 Jan;41(Database issue):D377-86. doi: 10.1093/nar/gks1118. Epub 2012 Nov 27. Nucleic Acids Res. 2013. PMID: 23193289 Free PMC article. - PANTHER: Making genome-scale phylogenetics accessible to all.
Thomas PD, Ebert D, Muruganujan A, Mushayahama T, Albou LP, Mi H. Thomas PD, et al. Protein Sci. 2022 Jan;31(1):8-22. doi: 10.1002/pro.4218. Epub 2021 Nov 25. Protein Sci. 2022. PMID: 34717010 Free PMC article. Review. - An Experimental Approach to Genome Annotation: This report is based on a colloquium sponsored by the American Academy of Microbiology held July 19-20, 2004, in Washington, DC.
[No authors listed] [No authors listed] Washington (DC): American Society for Microbiology; 2004. Washington (DC): American Society for Microbiology; 2004. PMID: 33001599 Free Books & Documents. Review.
Cited by
- Cellular-resolution gene expression profiling in the neonatal marmoset brain reveals dynamic species- and region-specific differences.
Kita Y, Nishibe H, Wang Y, Hashikawa T, Kikuchi SS, U M, Yoshida AC, Yoshida C, Kawase T, Ishii S, Skibbe H, Shimogori T. Kita Y, et al. Proc Natl Acad Sci U S A. 2021 May 4;118(18):e2020125118. doi: 10.1073/pnas.2020125118. Proc Natl Acad Sci U S A. 2021. PMID: 33903237 Free PMC article. - Differential regulation of cytotoxicity pathway discriminating between HIV, HCV mono- and co-infection identified by transcriptome profiling of PBMCs.
Wu JQ, Saksena MM, Soriano V, Vispo E, Saksena NK. Wu JQ, et al. Virol J. 2015 Jan 27;12:4. doi: 10.1186/s12985-014-0236-6. Virol J. 2015. PMID: 25623235 Free PMC article. - In silico identification of common and specific signatures in coronary heart diseases.
Yang Z, Ma H, Liu W. Yang Z, et al. Exp Ther Med. 2020 Oct;20(4):3595-3614. doi: 10.3892/etm.2020.9121. Epub 2020 Aug 13. Exp Ther Med. 2020. PMID: 32905032 Free PMC article. - Gene Function Prediction Based on Developmental Transcriptomes of the Two Sexes in C. elegans.
Kim B, Suo B, Emmons SW. Kim B, et al. Cell Rep. 2016 Oct 11;17(3):917-928. doi: 10.1016/j.celrep.2016.09.051. Cell Rep. 2016. PMID: 27732864 Free PMC article. - Genome-wide DNA hydroxymethylation identifies potassium channels in the nucleus accumbens as discriminators of methamphetamine addiction and abstinence.
Cadet JL, Brannock C, Krasnova IN, Jayanthi S, Ladenheim B, McCoy MT, Walther D, Godino A, Pirooznia M, Lee RS. Cadet JL, et al. Mol Psychiatry. 2017 Aug;22(8):1196-1204. doi: 10.1038/mp.2016.48. Epub 2016 Apr 5. Mol Psychiatry. 2017. PMID: 27046646 Free PMC article.
References
- Venter JC, Adams MD, Myers EW, Li PW, et al. The sequence of the human genome. Science 291, 1304–1351 (2001). - PubMed
Publication types
MeSH terms
Substances
LinkOut - more resources
Full Text Sources
Other Literature Sources


