Neurotransmitter-triggered transfer of exosomes mediates oligodendrocyte-neuron communication - PubMed (original) (raw)
. 2013 Jul;11(7):e1001604.
doi: 10.1371/journal.pbio.1001604. Epub 2013 Jul 9.
Dominik Fröhlich, Wen Ping Kuo, Jesa Amphornrat, Sebastian Thilemann, Aiman S Saab, Frank Kirchhoff, Wiebke Möbius, Sandra Goebbels, Klaus-Armin Nave, Anja Schneider, Mikael Simons, Matthias Klugmann, Jacqueline Trotter, Eva-Maria Krämer-Albers
Affiliations
- PMID: 23874151
- PMCID: PMC3706306
- DOI: 10.1371/journal.pbio.1001604
Neurotransmitter-triggered transfer of exosomes mediates oligodendrocyte-neuron communication
Carsten Frühbeis et al. PLoS Biol. 2013 Jul.
Abstract
Reciprocal interactions between neurons and oligodendrocytes are not only crucial for myelination, but also for long-term survival of axons. Degeneration of axons occurs in several human myelin diseases, however the molecular mechanisms of axon-glia communication maintaining axon integrity are poorly understood. Here, we describe the signal-mediated transfer of exosomes from oligodendrocytes to neurons. These endosome-derived vesicles are secreted by oligodendrocytes and carry specific protein and RNA cargo. We show that activity-dependent release of the neurotransmitter glutamate triggers oligodendroglial exosome secretion mediated by Ca²⁺ entry through oligodendroglial NMDA and AMPA receptors. In turn, neurons internalize the released exosomes by endocytosis. Injection of oligodendroglia-derived exosomes into the mouse brain results in functional retrieval of exosome cargo in neurons. Supply of cultured neurons with oligodendroglial exosomes improves neuronal viability under conditions of cell stress. These findings indicate that oligodendroglial exosomes participate in a novel mode of bidirectional neuron-glia communication contributing to neuronal integrity.
Conflict of interest statement
The authors have declared that no competing interests exist.
Figures
Figure 1. Neuronal recombination in MOGi-Cre/lacZ reporter mice.
(A–D) Immunohistochemical analysis of brain sections derived from MOGi-Cre/Rosa26-LacZ reporter mice. β-galactosidase positive cells were stained using X-gal as substrate and neurons were labeled with antibodies against NeuN. Recombined cells were detected in the cortex (Ctx, A, C), cerebellum (Cb, B), and brainstem (Bst, D). Scale bar, 50 µm. (E) MOG and NG2 expression analysis by q-PCR of E10, E14, P0, P7, and adult total brains (n = 3). The maximal expression was set to 1. NG2 is shown as an example of a gene expressed in progenitor cells.
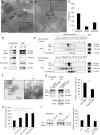
Figure 2. Adaxonal localization of MVBs and glutamate-dependent release of exosomes.
(A–C) Immuno-electron microscopy analysis of cross-sections of myelinated axons in the optic nerve or spinal cord of adult mice labeled with antibodies against PLP (scale bar, 250 nm, asterisk marks adaxonal loop). Insets depict enlarged views of a MVB in the oligodendrocyte adaxonal cytoplasmic loop (A) and a fusion profile indicating the release of vesicles with the size corresponding to exosomes (B). (C) Quantification of MVBs located adaxonal, abaxonal, and within compact myelin in optic nerves. MVB number was normalized per axon. (D) Western blot analysis of PLP, Alix, Hsc/Hsp70, and calnexin (CNX) in cell lysates and exosomes pelleted by differential centrifugation from culture supernatants of primary oligodendrocytes (pOL) treated with glutamate (Glu, 100 µM) for 5 h or untreated (untr.). (E) Density gradient analysis of exosomes purified from supernatants of pOL treated with 100 µM glutamate versus untreated control cells. (F) Electron microscopic analysis of 100,000× g exosome pellets derived from supernatants collected over a period of 5 h from untreated (left image) or glutamate-treated cells (100 µM). Scale bar, 100 nm. (G) Transfection of pOL with Rab35- or control-siRNA (Ctrl) and quantification of glutamate-dependent exosome release. Western blot signals of exosomal PLP were normalized to total cellular PLP and defined as relative exosome release (n = 5). (H) Administration of 50 (n = 5), 100 (n = 8), 200 µM (n = 10) glutamate to pOL, and quantitative analysis of exosome release. (I) Incubation of pOL with the Ca2+-chelator EDTA and quantification of glutamate-dependent exosome release (n = 3). Error bars, SEM (* p<0.05; Wilcoxon test).
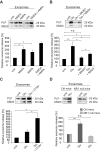
Figure 3. NMDA and AMPA receptors mediate exosome release.
Quantification of exosome release upon (A) stimulation with glutamate receptor agonists NMDA (100 µM, n = 7), AMPA (100 µM, n = 5), or NMDA and AMPA (n = 4), (B) application of NMDA and AMPA receptor antagonists MK801 (5 µM, n = 9) or NBQX (25 µM, n = 9), or (C) the NMDA receptor co-agonist D-Serine (100 µM, n = 5). (D) Glutamate-stimulated exosome release from NMDA receptor-deficient oligodendrocytes obtained from CNPCre/+*NR1flox/flox mice (n = 6) compared to CNPCre/+ control mice (n = 9). Representative Western blots of PLP in exosome pellets are depicted. Error bars, SEM (n.s., not significant ; * p<0.05; ** p<0.01; Wilcoxon test).
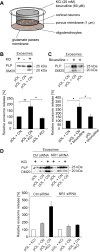
Figure 4. Neuronal activity stimulates exosome release from oligodendrocytes.
(A) Cartoon illustrating the Boyden chamber co-culture of cortical neurons (CN) and pOL separated by a membrane permitting exchange of metabolites and small particles (<1 µm). (B) Application of 20 mM KCl (n = 9) or (C) 60 µM bicuculline (n = 6) to CN in the top well and analysis of relative exosome release from pOL. KCl or bicuculline applied to pOL is depicted as control (n = 5). (D) Boyden chamber co-culture of CN and pOL transfected with siRNA against NR1 or control siRNA. Depolarization of CN with 20 mM KCl and quantification of oligodendroglial exosome release (n = 3). Error bars, SEM (* p<0.05; ** p<0.01; Wilcoxon test).
Figure 5. Primary cortical neurons internalize oligodendroglial exosomes.
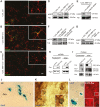
(A–D) pOL were stained with the lipophilic dye PKH67 (green), washed, and subsequently co-cultured in Boyden chambers for 2 d with mixed neural cultures containing astrocytes (A, B, blue marker GFAP), oligodendrocytes (B, red marker O4), and microglia (A, red marker F4/80, B, arrowheads) or with CN (C, red marker Tuj1). Scale bar, 20 µm. (D) Quantification of exosome uptake by the different types of target cells. Error bars, SEM, (n = 3). (E) Fluorescent exosomes containing SIRT2-EYFP and PLP-EGFP were purified by sucrose density gradient centrifugation from Oli-neu cells and co-incubated with CN for 24 h. The Western blot depicts EGFP and the exosomal marker Tsg101 in gradient fractions. Images show maximum projections of confocal Z-stacks of Tuj1-stained neurons after incubation with exosomes (scale bar, 5 µm). (F) Western blots of purified Oli-neu exosomes (input, left lane) and neuronal lysates after treatment with exosomes (Exo). EGFP/EYFP depicts exosome markers, Tubulin (Tub) is used as normalization standard. Relative exosome uptake reflects normalized signals of SIRT2-EYFP and PLP-EGFP associated with neuronal lysates (n = 8). (G) To remove surface-bound exosomes, neurons were treated with trypsin (Tryp) before lysis (n = 5). (H–K) Boyden chamber co-culture of oligodendroglial cells and CN for 2–3 d and analysis of exosomal PLP and SIRT2 in neurons by Western blot (H, I, and K) or immunostaining (J). (H) PLP-EGFP and SIRT2-EYFP expressing Oli-neu cells were treated or not with 5 µM GW4869 inhibiting exosome release (n = 6). (I) pOL were treated with 100 µM glutamate stimulating exosome release (n = 5). (J) Co-culture of CN with PKH67-labelled (green) pOL and immunostaining of CN with Tuj1 (red) and the late endosomal/lysosomal marker LAMP1 (blue). Maximum projection of a confocal Z-stack. Scale bar, 5 µm. (K) Neurons were pre-treated with Dynasore and co-cultured for 1 d with Oli-neu cells releasing SIRT2-EYFP and PLP-EGFP labeled exosomes (n = 4). Error bars, SEM (* p<0.05; Wilcoxon-test).
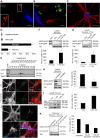
Figure 6. Functional retrieval of exosomal cargo by neurons.
(A–G) Boyden chamber co-culture of pOL transduced by recombinant AAV/MBP-Cre (pOL-MBP-Cre) and CN transduced by AAV/CBA-floxstop-hrGFP reporter vector. hrGFP expression indicates Cre-mediated recombination. Tuj1 staining (red) of CN exposed to (A) nontransduced pOL, (B) pOL-MBP-Cre, or (C) pOL-MBP-Cre treated with 5 µM GW4869. Scale bar, 100 µm. (D–G) Reporter gene expression (hrGFP) in target neurons detected by Western blotting of neuronal lysates. CN were exposed to (D) pOL-MBP-Cre treated or not with 100 µM glutamate, (E) transfected with Rab35 or control siRNA, or (F) treated or not with 5 µM GW4869. (F, right lane) Exposure of CN to exosome-depleted culture supernatant from pOL-MBP-Cre does not lead to reporter gene expression in neurons. (G) pOL, Oli-neu cells, or HEK cells transduced with AAV/MBP-Cre co-cultured with CN. (H) Cre RT-PCR and (I) Western blot of exosomes derived from pOL-MBP-Cre or control cells. Pgk1 (mRNA), PLP/DM20, and Alix (protein) are shown as standards. (J–L) Stereotactic injection of exosomes derived from pOL-MBP-Cre into the (J, K) hippocampus (HC) and (L) cerebellum of ROSA26-lacZ reporter mice. β-galactosidase positive cells were stained using X-gal and neurons were stained for (K) neuron-specific enolase (NSE) or for (L) GABA-Rα6. Mice (n = 5) were analyzed 14 d after injection.
Figure 7. Somatodendritic and axonal uptake of exosomes.
CN were cultured in microfluidic chambers and axons were allowed to grow through the microgrooves for 7 d. Exosomes isolated from PKH67 stained (A, B green) or AAV/MBP-Cre infected pOL (C, D) were applied to either the somatodendritic (A, C) or axonal (B, D) compartment of the device. Cre-containing exosomes were added to AAV/CBA-floxstop-hrGFP infected CN. hrGFP expression indicates Cre-mediated recombination (C, D green). CN were stained with Tuj1 (red) and nuclei with Dapi (blue). Scale bar, 20 µm. (E) Quantification of recombinant neurons located within 100 µm above the microgrooves. Exemplary pictures are depicted above the chart. Asterisk indicates the area of quantification. Error bars, SEM (n = 4).
Figure 8. Neuroprotective role of oligodendroglial exosomes.
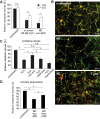
(A) Boyden chamber co-culture of CN with or without pOL for 48 h under unstressed, oxidative stress, or nutrient deprivation (ND) conditions. Control CN cultured without pOL (black bars) were grown in oligodendrocyte-conditioned medium depleted from exosomes. Oxidative stress was induced after co-culture by challenging CN with 25 µM H2O2 for 1 h (n = 5). For nutrient deprivation, cells were cultured in medium lacking B27 supplement (n = 5). Neuronal viability was assayed by MTT assay. (B) Staining of the outer mitochondrial membrane with MitoCapture after nutrient deprivation and co-culture with and without pOL. Unstressed cells were grown in full medium without pOL. Scale bar, 100 µm. (C) Application of isolated exosomes and liposomes to neurons under conditions of cell stress. MTT assay of CN after single addition of isolated exosomes from pOL and HEK293T cells as well as liposomes 12–14 h prior to H2O2 stress (25 µM for 1 h) compared to unstressed or sham treated controls (n = 5). (D) MTT assay of CN subjected to nutrient deprivation and treated with exosome-containing (SN+exos) or exosome-deprived (SN w/o exos) oligodendrocyte culture supernatants for 12–14 h (n = 5). Error bars, SEM (n.s., not significant; * p<0.05; Wilcoxon-test).
Figure 9. Oligodendroglial exosome secretion and its role in reciprocal neuron-glia communication.
Electrically active axons release the neurotransmitter glutamate (1) inducing Ca2+-entry through oligodendroglial glutamate receptors (2). The rise in intracellular Ca2+ triggers exosome release from oligodendrocytes (OL) along internodes or at somas (3). In turn, exosomes are internalized by neurons (N) at axons or cell bodies (4) and their protein and RNA cargo is functionally retrieved (5). Exosome uptake by microglia (M) is also indicated.
Comment in
- Glia: Transporting cargo from A to B.
Lewis S. Lewis S. Nat Rev Neurosci. 2013 Sep;14(9):589. doi: 10.1038/nrn3568. Epub 2013 Jul 31. Nat Rev Neurosci. 2013. PMID: 23900413 No abstract available.
Similar articles
- Multifaceted effects of oligodendroglial exosomes on neurons: impact on neuronal firing rate, signal transduction and gene regulation.
Fröhlich D, Kuo WP, Frühbeis C, Sun JJ, Zehendner CM, Luhmann HJ, Pinto S, Toedling J, Trotter J, Krämer-Albers EM. Fröhlich D, et al. Philos Trans R Soc Lond B Biol Sci. 2014 Sep 26;369(1652):20130510. doi: 10.1098/rstb.2013.0510. Philos Trans R Soc Lond B Biol Sci. 2014. PMID: 25135971 Free PMC article. - Oligodendrocytes support axonal transport and maintenance via exosome secretion.
Frühbeis C, Kuo-Elsner WP, Müller C, Barth K, Peris L, Tenzer S, Möbius W, Werner HB, Nave KA, Fröhlich D, Krämer-Albers EM. Frühbeis C, et al. PLoS Biol. 2020 Dec 22;18(12):e3000621. doi: 10.1371/journal.pbio.3000621. eCollection 2020 Dec. PLoS Biol. 2020. PMID: 33351792 Free PMC article. - Emerging roles of exosomes in neuron-glia communication.
Frühbeis C, Fröhlich D, Krämer-Albers EM. Frühbeis C, et al. Front Physiol. 2012 Apr 30;3:119. doi: 10.3389/fphys.2012.00119. eCollection 2012. Front Physiol. 2012. PMID: 22557979 Free PMC article. - Neurotransmitter-mediated calcium signalling in oligodendrocyte physiology and pathology.
Butt AM. Butt AM. Glia. 2006 Nov 15;54(7):666-675. doi: 10.1002/glia.20424. Glia. 2006. PMID: 17006895 Review. - Exosome Circuitry During (De)(Re)Myelination of the Central Nervous System.
Domingues HS, Falcão AM, Mendes-Pinto I, Salgado AJ, Teixeira FG. Domingues HS, et al. Front Cell Dev Biol. 2020 Jun 16;8:483. doi: 10.3389/fcell.2020.00483. eCollection 2020. Front Cell Dev Biol. 2020. PMID: 32612996 Free PMC article. Review.
Cited by
- Exosome-mediated inflammasome signaling after central nervous system injury.
de Rivero Vaccari JP, Brand F 3rd, Adamczak S, Lee SW, Perez-Barcena J, Wang MY, Bullock MR, Dietrich WD, Keane RW. de Rivero Vaccari JP, et al. J Neurochem. 2016 Jan;136 Suppl 1(0 1):39-48. doi: 10.1111/jnc.13036. Epub 2015 Mar 1. J Neurochem. 2016. PMID: 25628216 Free PMC article. - MiR-100-5p-rich small extracellular vesicles from activated neuron to aggravate microglial activation and neuronal activity after stroke.
Xin D, Li T, Zhao Y, Guo X, Gai C, Jiang Z, Yu S, Cheng J, Song Y, Cheng Y, Luo Q, Gu B, Liu D, Wang Z. Xin D, et al. J Nanobiotechnology. 2024 Sep 3;22(1):534. doi: 10.1186/s12951-024-02782-0. J Nanobiotechnology. 2024. PMID: 39227960 Free PMC article. - Extracellular Vesicles miRNA Cargo for Microglia Polarization in Traumatic Brain Injury.
Panaro MA, Benameur T, Porro C. Panaro MA, et al. Biomolecules. 2020 Jun 12;10(6):901. doi: 10.3390/biom10060901. Biomolecules. 2020. PMID: 32545705 Free PMC article. Review. - The Emerging Role of Extracellular Vesicles in the Glioma Microenvironment: Biogenesis and Clinical Relevance.
Balakrishnan A, Roy S, Fleming T, Leong HS, Schuurmans C. Balakrishnan A, et al. Cancers (Basel). 2020 Jul 19;12(7):1964. doi: 10.3390/cancers12071964. Cancers (Basel). 2020. PMID: 32707733 Free PMC article. Review. - Integrin Regulation in Immunological and Cancerous Cells and Exosomes.
Soe ZY, Park EJ, Shimaoka M. Soe ZY, et al. Int J Mol Sci. 2021 Feb 23;22(4):2193. doi: 10.3390/ijms22042193. Int J Mol Sci. 2021. PMID: 33672100 Free PMC article. Review.
References
- Sherman DL, Brophy PJ (2005) Mechanisms of axon ensheathment and myelin growth. Nat Rev Neurosci 6: 683–690. - PubMed
- Nave KA (2010) Myelination and support of axonal integrity by glia. Nature 468: 244–252. - PubMed
- Emery B (2010) Regulation of oligodendrocyte differentiation and myelination. Science 330: 779–782. - PubMed
Publication types
MeSH terms
Substances
Grants and funding
The study was supported by grants of ELA (2007-027C1) and DFG (KR 3668/1-1) to EMKA, DFG SFB 894 (A12) to FK, DFG Research Center Molecular Physiology of the Brain (CNMPB), and ERC Advanced Grant to KAN. CF received internal research funding for early career researchers from JGU Mainz. MK is an Australian Research Council (ARC) Future Fellow. DF received fellowships from the Stipendienstiftung Rheinland Pfalz and the DFG GRK 1044. WPK is a fellow of the Focus Program Translational Neuroscience JGU Mainz. The funders had no role in study design, data collection and analysis, decision to publish, or preparation of the manuscript.
LinkOut - more resources
Full Text Sources
Other Literature Sources
Molecular Biology Databases
Research Materials
Miscellaneous

