Advantages of Single-Molecule Real-Time Sequencing in High-GC Content Genomes - PubMed (original) (raw)
Advantages of Single-Molecule Real-Time Sequencing in High-GC Content Genomes
Seung Chul Shin et al. PLoS One. 2013.
Abstract
Next-generation sequencing has become the most widely used sequencing technology in genomics research, but it has inherent drawbacks when dealing with high-GC content genomes. Recently, single-molecule real-time sequencing technology (SMRT) was introduced as a third-generation sequencing strategy to compensate for this drawback. Here, we report that the unbiased and longer read length of SMRT sequencing markedly improved genome assembly with high GC content via gap filling and repeat resolution.
Conflict of interest statement
Competing Interests: JEL is an employee of DNALink, Inc. There are no patents, products in development or marketed products to declare. This does not alter the authors' adherence to all the PLOS ONE policies on sharing data and materials.
Figures
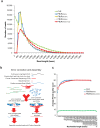
Figure 1. Statistics of error-corrected reads.
(a) The length distribution of CLRs and PBcRs. Error correction of CLRs with Illumina short reads (50×, 100× and 200× coverage) showed similar length distributions. Larger numbers of Illumina short reads did not improve the results of error correction in the mean length of reads and throughput, but CCS reads increased both in mean length and throughput. (b) CCS increased the throughput of error correction by joining the break positions with no short-read coverage. (c) Base qualities of CLRs and PBcRs, where the x-axis correspnds to base position and the y-axis to the average Phred quality score.
Figure 2. Results of error correction using 50× SR and 16× CCS reads.
HAWKEYE indicated how to correct the errors of CLR with SRs (blue) and CCS reads (red). The numbers indicate the regions aligned with only CCS reads. CCS reads improved the throughput of error correction by spanning the unaligned region by SRs.
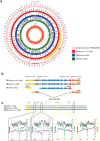
Figure 3. Streptomyces sp. PAMC 26508 assembly.
(a) The outermost track (pink) represents the complete genome sequence of Streptomyces sp. PAMC 26508, the middle track (red) represents assembly with PBcRSR(50×)+CCS, the inner track (blue) represents assembly with PBcRSR(50×) and the next track (green) represents assembly with SR. The innermost track (red line) indicates the read coverage of assembled contigs with PBcRSR(50×)+CCS. The numbers along the track indicate kilobase coordinates along the contig. The highlighted region H01 indicates the region of mis-assembled contig by repeat (Fig. 3b) and the highlighted region H02 indicates the representative region showing the differences in assemblies (Fig. 3c). (b) Red arrow indicates interspersed repeat sequences of the integrase gene. Contigs assembled from SRs(100×) with short read length were mis-assembled and split into three contigs by two integrase genes with identical sequences (600 bp long), but both PBcRSR(50×) and PBcRSR(50×)+CCS could resolve repeats due to their ability to span repeats. (c) The box indicates two types of gap: the black box indicates the gaps generated by assembly with both SRs(100×) and PBcRs reads, and the yellow box indicates the gaps generated by assembly with only SRs(100×) reads. Black line is GC content, and green, blue and red lines are each coverage, respectively. Each coverage and the average GC content for 25 base window of the flanking 1-kb region of gaps in assemblies. Gaps generated by assembly using short reads were filled with sufficient coverage of PBcRs, and PBcRSR(50×)+CCS was able to span more gaps than PBcRSR(50×). The local GC content of gaps is relatively higher than contigs.
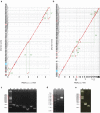
Figure 4. Dot plot showed that the assembly PBcRSR(50×)+CCS+454 was more accurate than other assembies.
SRs(100×)+454 to the contigs assembled with PBcRs. (a) contigs of the assembly SRs(100×)+454 vs. contigs of PBcRSR(50×)+CCS+454. (b) contigs of the assembly SRs(100×)+454 vs. contigs of PBcRSR(50×)+454. Horizontal and vertical dotted lines indicate the boundaries of each contig. The red contig number indicate the mis-assembled contigs, and the blue contig number and rectangle indicate the region of mis-assembled contigs in Fig. 3b. (c) PCR validation of disagreements between Illumina short-read assembly and PBcR assembly (V1∼V7). Amplified V1∼V7 products showed that the contigs of the assembly SRs(100×)+454 were mis-assembled. (d) Contig 551 in the assembly PBcRSR(50×)+454 was confirmed to be mis-assembled in the region of ribosomal RNA operons with amplified V8 and V9 product. (e) The region of mis-assembled contig in Fig. 3b (indicated in blue rectangle of a and b) were validated by PCR: integrase 1 (lane1) and integrase 2 (lane2).
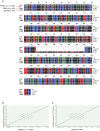
Figure 5. PBcRs resolved the collapsed tandem repeat in the chromosome of Streptomyces sp. PAMC26508.
(a) The region of tandem repeats was amplified by PCR and sequenced. The tandem repeat was mis-assembled in the assembly SRs(100×)+454 due to the short length, but PBcRs resolved the tandem repeat by spanning the entire region. (b) The dot plot shows alignment of PCR product to the contig of PBcRSR(50×)+CCS+454. (c) The dot plot shows the alignment of PCR product to the contig of SRs(100×)+454.
Similar articles
- Evaluation of strategies for the assembly of diverse bacterial genomes using MinION long-read sequencing.
Goldstein S, Beka L, Graf J, Klassen JL. Goldstein S, et al. BMC Genomics. 2019 Jan 9;20(1):23. doi: 10.1186/s12864-018-5381-7. BMC Genomics. 2019. PMID: 30626323 Free PMC article. - Completion of draft bacterial genomes by long-read sequencing of synthetic genomic pools.
Derakhshani H, Bernier SP, Marko VA, Surette MG. Derakhshani H, et al. BMC Genomics. 2020 Jul 29;21(1):519. doi: 10.1186/s12864-020-06910-6. BMC Genomics. 2020. PMID: 32727443 Free PMC article. - The impact of RNA secondary structure on read start locations on the Illumina sequencing platform.
Price A, Garhyan J, Gibas C. Price A, et al. PLoS One. 2017 Feb 28;12(2):e0173023. doi: 10.1371/journal.pone.0173023. eCollection 2017. PLoS One. 2017. PMID: 28245230 Free PMC article. - Exploring the hepatitis C virus genome using single molecule real-time sequencing.
Takeda H, Yamashita T, Ueda Y, Sekine A. Takeda H, et al. World J Gastroenterol. 2019 Aug 28;25(32):4661-4672. doi: 10.3748/wjg.v25.i32.4661. World J Gastroenterol. 2019. PMID: 31528092 Free PMC article. Review. - [The principle and application of the single-molecule real-time sequencing technology].
Liu YH, Wang L, Yu L. Liu YH, et al. Yi Chuan. 2015 Mar;37(3):259-268. doi: 10.16288/j.yczz.14-323. Yi Chuan. 2015. PMID: 25787000 Review. Chinese.
Cited by
- The Research Progress of Single-Molecule Sequencing and Its Significance in Nucleic Acid Metrology.
Wang Y, Liu J, Wang Z, Zhang M, Zhang Y. Wang Y, et al. Biosensors (Basel). 2024 Dec 25;15(1):4. doi: 10.3390/bios15010004. Biosensors (Basel). 2024. PMID: 39852055 Free PMC article. Review. - Improved assembly of noisy long reads by k-mer validation.
Carvalho AB, Dupim EG, Goldstein G. Carvalho AB, et al. Genome Res. 2016 Dec;26(12):1710-1720. doi: 10.1101/gr.209247.116. Epub 2016 Oct 7. Genome Res. 2016. PMID: 27831497 Free PMC article. - Comparison of actionable events detected in cancer genomes by whole-genome sequencing, in silico whole-exome and mutation panels.
Ramarao-Milne P, Kondrashova O, Patch AM, Nones K, Koufariotis LT, Newell F, Addala V, Lakis V, Holmes O, Leonard C, Wood S, Xu Q, Mukhopadhyay P, Naeini MM, Steinfort D, Williamson JP, Bint M, Pahoff C, Nguyen PT, Twaddell S, Arnold D, Grainge C, Basirzadeh F, Fielding D, Dalley AJ, Chittoory H, Simpson PT, Aoude LG, Bonazzi VF, Patel K, Barbour AP, Fennell DA, Robinson BW, Creaney J, Hollway G, Pearson JV, Waddell N. Ramarao-Milne P, et al. ESMO Open. 2022 Aug;7(4):100540. doi: 10.1016/j.esmoop.2022.100540. Epub 2022 Jul 15. ESMO Open. 2022. PMID: 35849877 Free PMC article. - First Complete Genome Sequence of Pseudomonas aeruginosa (Schroeter 1872) Migula 1900 (DSM 50071T), Determined Using PacBio Single-Molecule Real-Time Technology.
Nakano K, Terabayashi Y, Shiroma A, Shimoji M, Tamotsu H, Ashimine N, Ohki S, Shinzato M, Teruya K, Satou K, Hirano T. Nakano K, et al. Genome Announc. 2015 Aug 20;3(4):e00932-15. doi: 10.1128/genomeA.00932-15. Genome Announc. 2015. PMID: 26294631 Free PMC article. - Leveraging Whole-Genome Resequencing to Uncover Genetic Diversity and Promote Conservation Strategies for Ruminants in Asia.
Wang Q, Lu Y, Li M, Gao Z, Li D, Gao Y, Deng W, Wu J. Wang Q, et al. Animals (Basel). 2025 Mar 13;15(6):831. doi: 10.3390/ani15060831. Animals (Basel). 2025. PMID: 40150358 Free PMC article. Review.
References
- Schadt EE, Turner S, Kasarskis A (2010) A window into third-generation sequencing. Hum Mol Genet 19: R227–240. - PubMed
Publication types
MeSH terms
LinkOut - more resources
Full Text Sources
Other Literature Sources
Miscellaneous


