The cyclophilin CYP20-2 modulates the conformation of BRASSINAZOLE-RESISTANT1, which binds the promoter of FLOWERING LOCUS D to regulate flowering in Arabidopsis - PubMed (original) (raw)
The cyclophilin CYP20-2 modulates the conformation of BRASSINAZOLE-RESISTANT1, which binds the promoter of FLOWERING LOCUS D to regulate flowering in Arabidopsis
Yuanyuan Zhang et al. Plant Cell. 2013 Jul.
Abstract
Brassinosteroids (BRs) regulate many physiological processes during plant development, including flowering. However, little is known about the components of BR signaling that mediate flowering. Here, we report that BRASSINAZOLE-RESISTANT1 (BZR1), the conformation of which is altered by a cyclophilin (CYP20-2), binds cis-elements in the FLOWERING LOCUS D (FLD) promoter to regulate flowering. Both bzr1-1D and fld-4 showed delayed flowering. Electrophoretic mobility shift assay and chromatin immunoprecipitation revealed that BZR1 bound to a putative BR response cis-element and suppressed the expression of FLD. Overexpression of FLD partially rescued the late flowering of pBZR1:mBZR1(Pro234-Leu)-CFP (mx3). Yeast two-hybrid and pull-down assays demonstrated that BZR1 interacts with CYP20-2. Arabidopsis thaliana CYP20-2 had greater peptidyl-prolyl cis-trans isomerase activity than did wheat (Triticum aestivum) CYP20-2. Fourier transform infrared spectroscopy revealed conformation changes in BZR1, dependent on interaction with CYP20-2. Due to differences in activity and substrate preference between CYP20-2 proteins from wheat and Arabidopsis, At-CYP20-2-overexpressing lines showed earlier flowering, whereas Ta CYP20-2 lines flowered later. Immunoblot and chromatin immunoprecipitation assays showed that histone H3 trimethyl Lys4 and H3 acetylation levels were negatively correlated with the transcription of FLD (a putative histone demethylase) in various lines. Therefore, a conformational change of BZR1 mediated by CYP20-2 causes altered flowering through modulation of FLD expression.
Figures
Figure 1.
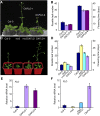
Late Flowering Phenotypes of mx3 and bzr1-1D. (A) and (B) Phenotype (A) and flowering time (B) of mutants (mx3 and bzr1-1D) and the wild type (Col-0) grown under long-day (LD) conditions. Twenty plants were scored. Data are mean ±
sd
. Bar = 1 cm. (C) and (D) Phenotypes of rosette leaves in the obverse (C) and reverse (D) view. Bar = 1 cm.
Figure 2.
BZR1 Binds to the Promoter of FLD. **(A)**EMSA assay in vitro showing that the MBP-BZR1 fusion protein, but not MBP alone, binds to the FLD promoter (Probe). The diagram depicts the promoter sequence of the FLD gene. The red letters represent the hypothetical binding element (CGTG). M1, CGTG was mutated as CAAG; M2, CGTG was mutated as AAAA. Competitor indicates 200-fold excess unlabeled competitor probe added to compete with the labeled probe. Positive control, probe designed according to the core binding _cis_-element of BZR1 with flank sequences deposited in the CONSTITUTIVE PHOTOMORPHOGENIC DWARF (CPD) promoter (CAGAAACCCCC
CGTG
TGCCC). The amount of MBP-BZR1 was 0.5 μg for lane 5 and 2 μg for the other lanes. **(B)**ChIP assay with antibody to GFP. Quantitative real-time PCR analysis of products immunoprecipitated from wild-type (WT), BZR1-CFP (W2C), and mBZR1-CFP (mx3) transgenic plants. Data are mean ±
sd
of triplicate experiments. (C) Schematic diagrams of reporter and effector constructs used in the protoplast transcription system. (D) Expression activity assay of BRRE-, mBRRE-, _pFLD_-, and _pmFLD_-LUC reporter genes in Arabidopsis protoplasts transformed with the plasmid 35S:BZR1 or empty vector (EV), with 35S:GUS as an internal control. Data are mean ±
sd
of triplicate experiments. (E) FLD transcript levels in the wild-type, pBZR1:BZR1-CFP (W2C), and pBZR1:mBZR1-CFP (mx3) transgenic plants. Data are mean ±
sd
of triplicate experiments.
Figure 3.
OX_FLD_ Transgenic Arabidopsis Shows an Early Flowering Phenotype and Partially Rescued the Late Flowering Phenotype of mx3. (A) and (B) Flowering phenotype of Col-0, OX_FLD_-1, and OX_FLD_-6 transgenic lines grown in light under long-day conditions for 27 d. Data are mean ±
sd
. For each line, 25 plants were scored. (C) and (D) Flowering phenotype of Col-0, mx3, mx3 OX_FLD_, and OX_FLD Arabidopsis_ grown in light under long-day conditions for 35 d. Data are mean ±
sd
. For each line, 20 plants were scored. (E) and (F) Quantitative RT-PCR analysis of FLD transcript in transgenic lines and Col-0. Data are mean ±
sd
of triplicate experiments.
Figure 4.
pmFLD:FLD Partially Rescued the Late Flowering Phenotype of mx3. (A) and (B) Flowering phenotype of Col-0, fld-4, fld-4 pm:FLD, and fld-4 p:FLD transgenic lines grown in the light for 35 d under long-day conditions. Data are mean ±
sd
. For each line, 20 plants were scored. Bar = 1 cm. (C) Quantitative RT-PCR analysis of FLD transcript in transgenic lines and the wild type. (D) and (E) Flowering phenotype of Col-0, mx3, mx3 pm:FLD, and mx3 p:FLD Arabidopsis grown in the light under long-day conditions for 35 d. Data are mean ±
sd
. For each line, 20 plants were scored. Bar = 1 cm. (F) Quantitative RT-PCR analysis of FLD transcript in transgenic lines and the wild type. Data are mean ±
sd
of triplicate experiments. *P < 0.05 and P > 0.05 compared with their parent mx3, respectively, as determined by Student’s t test. (G) and (H) Flowering phenotype of Col-0, bzr1-1D, bzr1-1D pm:FLD, and bzr1-1D p:FLD Arabidopsis grown in the light under long-day conditions for 35 d. Data are mean ±
sd
. For each line, 20 plants were scored. Bar = 1 cm. (I) Quantitative RT-PCR analysis of FLD transcript in transgenic lines and Col-0. Data are mean ±
sd
of triplicate experiments. *P < 0.05 and P > 0.05 compared with their parent bzr1-1D, respectively, as determined by Student’s t test. pm:FLD, pmFLD:FLD (FLD expression driven by the native promoter of FLD with the BRRE mutated to AGAGAG); p:FLD, pFLD:FLD (FLD expression driven by the native promoter of FLD with a wild-type BRRE). Data are mean ±
sd
of triplicate experiments.
Figure 5.
Protein Interaction between CYP20-2 and BZR1. (A) Interaction between Ta CYP20-2 and At BZR1 in yeast two-hybrid assays. Colonies of yeast containing the indicated combination of bait (BD) and prey (AD) vectors were cultured on -Trp-Leu-His-Ade selection medium. β-Galactosidase activity of positive clones was analyzed by use of X-gal. (B) Pull-down assay to confirm the interaction between Ta CYP20-2 and At BZR1. Glutathione agarose beads containing GST or GST-TaCYP20-2 were incubated with equal amounts of protein extract from mx3. Proteins bound to Sepharose 4B beads were pelleted, subjected to 12% SDS-PAGE, stained with Coomassie blue (CBB; left), and detected by immunoblot analysis with anti-GFP monoclonal antibody (right). WT, the wild type. (C) Pull-down assay to confirm the interaction between At CYP20-2 and BZR1. Glutathione agarose beads containing GST or GST-AtCYP20-2 were incubated with equal amounts of protein extract from mx3. Proteins bound to Sepharose 4B beads were pelleted, subjected to 12% SDS-PAGE, stained with Coomassie blue (left), and detected by immunoblot analysis with anti-GFP monoclonal antibody (right). (D) Coimmunoprecipitation assay to confirm the interaction between At CYP20-2 and BZR1. Tobacco leaves cotransformed with 35S:AtCYP20-2-YFP and 35S:BZR1-FLAG were used in immunoprecipitation assays with anti-GFP antibody, and the immunoblot was probed with anti-FLAG antibody.
Figure 6.
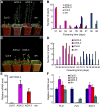
Flowering Phenotypes of 35S:At_CYP20-2_ Transgenic Arabidopsis. (A) to (D) The phenotype and time of flowering of Col-0, 35S:At_CYP20-2_ (AOX-2 and AOX-3), and cyp20-2 fkbp13 (dm) Arabidopsis grown under long-day conditions ([A] and [B]) or short-day conditions ([C] and [D]). Twenty-five plants were scored. (E) and (F) Quantitative RT-PCR analysis of At CYP20-2, FLD, FLC, and SOC1 in Col-0, 35S:At_CYP20-2_ overexpression lines, and cyp20-2 fkbp13 (dm). Data are mean ±
sd
(n = 3).
Figure 7.
Flowering Phenotype of 35S:Ta_CYP20-2_ Transgenic Arabidopsis. (A), (B), and (E) The flowering phenotypes in wild-type (WT; Col-0) and 35S:Ta_CYP20-2_ (TOX-6 and TOX-10) transgenic Arabidopsis grown under long-day (LD) (A) or short-day (SD) conditions (B) for 40 d after germination. Twenty plants were scored. Data are mean ±
sd
. (C) and (D) Effect on flowering of vernalization (V) (C) or GA treatment (D). (C) Col-0 and 35S:Ta_CYP20-2_ transgenic Arabidopsis grown at 4°C for 4 weeks and moved to LD conditions for 30 d. (D) Plants were treated with GA3 (20 μM) and grown under long-day conditions. (F) Immunoblot analysis of Ta CYP20-2 protein expression in Col-0 and 35S:Ta_CYP20-2_–overexpressing transgenic Arabidopsis with polyclonal anti-TaCYP20-2 antiserum. Total protein stained with Coomassie blue (ribulose-1,5-bisphosphate carboxylase/oxygenase [Rubisco]) shows equal loading. (G) Protein interaction between Ta CYP20-2/At CYP20-2 and the DELLA protein RGA was tested by yeast two-hybrid assays. The clones of yeast containing each combination of bait (BD) and prey (AD) vectors were cultured on -Trp-Leu-His-Ade selection medium. β-Galactosidase activity of positive clones was analyzed by use of X-gal. (H) Real-time RT-PCR analysis of the expression of GA biosynthesis genes At GA2ox2 and At GA20ox1 in 35S:At_CYP20-2_ and 35S:Ta_CYP20-2_ transgenic lines. The mean ±
sd
of three experiments is shown.
Figure 8.
35S:CYP20-2 Partially Rescued the BR-Related Phenotype in mx3. (A) Six-day-old dark-grown seedlings. From left to right: Col-0, A2 (35S:At_CYP20-2_ L2), A3 (35S:At_CYP20-2_ L3), dm (cyp20-2 fkbp13), T6 (35S:Ta_CYP20-2_ L6), mx3 (pBZR1:mBZR1-CFP), mx3Ta:mx3 35S:Ta_CYP20-2_, and mx3At:mx3 35S:At_CYP20-2_. Bar = 1 cm. (B) to (D) Seedlings were grown in the dark for 6 d with various concentrations of Brz, 0.1 μM (B), 0.5 μM (C), and 2 μM (D). From left to right: Col-0, A2 (35S:At_CYP20-2_ L2), A3 (35S:At_CYP20-2_ L3), dm (cyp20-2 fkbp13), T6 (35S:Ta_CYP20-2_ L6), mx3 (pBZR1:mBZR1-CFP), mx3Ta:mx3 35S:Ta_CYP20-2_, and mx3At:mx3 35S:At_CYP20-2_. Bar = 1 cm. (E) Relative length of hypocotyls. Twenty plants were measured. Data are mean ±
sd
. (F) From left to right: mx3 and mx3 35S:Ta_CYP20-2_ grown in the light for 25 d under long-day conditions. (G) Col-0, mx3, and mx3 35S:Ta_CYP20-2_ grown in the light for 50 d under long-day conditions. (H) Col-0, mx3, 35S:At_CYP20-2_, and mx3 35S:At_CYP20-2_ grown in the light for 25 d under long-day conditions. Bar = 1 cm. (I) Rosette leaves of mx3 and mx3 35S:Ta_CYP20-2_ plants. (J) From top to bottom line: Rosette leaves of mx3 35S:At CYP20-2 and mx3 plants. mx3Ta, mx3 35S:Ta CYP20-2; mx3At, mx3 35S:At CYP20-2.
Figure 9.
Effects of CYP20-2 Expression on mx3 Arabidopsis. (A) Real-time PCR of BZR1 transcript in Col-0, mx3, mx3 35S:Ta_CYP20-2_, and mx3 35S:At_CYP20-2_. Data are mean ±
sd
(n = 3). (B) Immunoblot analysis of mBZR1-CFP in Col-0, mx3, and mx3 35S:Ta_CYP20-2_. Total protein extracts were separated by 12% SDS-PAGE, and mBZR1-CFP was detected with anti-GFP polyclonal antibody. mx3 Ta, mx3 35S:Ta_CYP20-2_. Ribulose-1,5-bisphosphate carboxylase/oxygenase (Rubisco) served as a loading control in (B) and (C). (C) Immunoblot analysis of phosphorylation of mBZR1-CFP in Col-0, mx3, mx3 35S:Ta_CYP20-2_, and mx3 35S:At_CYP20-2_. In order to separate the p-mBZR1 and mBZR1, protein extracts were separated by 10% SDS-PAGE until proteins smaller than 55 kD were running off the gel. The proteins were detected with anti-GFP monoclonal antibody. mx3 Ta, mx3 35S:Ta_CYP20-2_; mx3At, mx3 35S:At_CYP20-2_. (D) Expression activity assay of the pFLD reporter gene in Arabidopsis protoplasts transformed with the plasmid 35:BZR1 in the presence of 35S:At_CYP20-2_ or 35S:Ta_CYP20-2_, with 35S:GUS as an internal control. Data are mean ±
sd
of triplicate experiments. (E) Both phosphorylated and unphosphorylated forms of BZR1 shown in (C) were quantified. In the table, the numbers represent the relative protein amounts using unphosphorylated forms of BZR1 in mx3 as 1.0. Numbers in parentheses represent the ratio of phosphorylated to unphosphorylated forms of BZR1.
Figure 10.
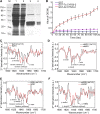
PPIase Activity of Ta CYP20-2 and At CYP20-2 and Their Effects on BZR1 Secondary Structure. (A) Expression and purification of GST-TaCYP20-2 and GST-AtCYP20-2 recombinant protein. Lane 1, total protein of DH5α cells containing the pGEX4T-1-TaCYP20-2 plasmid. Lane 2, total protein of DH5α cells containing the pGEX4T-1-AtCYP20-2 plasmid. Lane 3, GST-TaCYP20-2 fusion protein purified by glutathione-Sepharose 4B chromatography. Lane 4, GST-AtCYP20-2 fusion protein purified by glutathione-Sepharose 4B chromatography. **(B)**PPIase activity of recombinant Ta CYP20-2 (pink), At CYP20-2 (red), and GST (blue) at 10 nM. Data are mean ±
sd
(n = 3). (C) Second-derivative infrared spectra of BZR1 with or without GST-TaCYP20-2. Shown are MBP-BZR1 + GST-TaCYP20-2 minus the background absorption of MBP + GST-TaCYP20-2 (black) and MBP-BZR1 + GST minus the background absorption of MBP + GST (red); spectra were obtained in D2O medium. a.u., absorbance units. (D) Second-derivative infrared spectra of mBZR1 with or without GST-TaCYP20-2. Shown are MBP-mBZR1 + GST-TaCYP20-2 minus the background absorption of MBP + GST-Ta CYP20-2 (black) and MBP-mBZR1 + GST minus the background absorption of MBP + GST (red); spectra were obtained in a D2O medium. (E) Second-derivative infrared spectra of BZR1 with or without GST-At CYP20-2. Shown are with MBP-BZR1 + GST-AtCYP20-2 minus the background absorption of MBP+GST-AtCYP20-2 (black) and MBP-BZR1 + GST minus the background absorption of MBP + GST (red); spectra were obtained in D2O medium. (F) Second-derivative infrared spectra of mBZR1 with or without GST-AtCYP20-2. Shown are MBP-mBZR1 + GST-AtCYP20-2 minus the background absorption of MBP + GST-AtCYP20-2 (black) and MBP-mBZR1 + GST minus the background absorption of MBP + GST (red); spectra were obtained in a D2O medium.
Figure 11.
H3K4me3 and H3 Acetylation in FLC Chromatin Is Negatively Correlated with the Transcript Level of FLD. (A) Quantitative RT-PCR of FLD in Col-0, AOX-2, AOX-3 (35S:At_CYP20-2_), double mutant (cyp20-2 fkbp13), mx3 (pBZR1:mBZR1-CFP), mx3Ta (mx3 35S:Ta_CYP20-2), W2C (pBZR1:BZR1-CFP), and TOX-6 (35S:Ta_CYP20-2) plants. Data are mean ±
sd
(n = 3). Immunoblot analysis of histone modification levels. Histone-enriched protein extracts from 2-week-old Col-0, AOX-2, AOX-3, mx3, mx3 35S:Ta_CYP20-2_, W2C, and TOX-6 plants grown under long-day conditions were probed with antibodies to H3K4me3 and H3 acetylation. (B) Quantitative RT-PCR of FLC in Col-0, AOX-2, AOX-3 (35S:At_CYP20-2_), TOX-6 (35S:Ta_CYP20-2_), mx3 (pBZR1:mBZR1-CFP), mx3 Ta (mx3 35S:Ta_CYP20-2_), and mx3At (mx3 35S:At_CYP20-2_) plants. The mean ±
sd
of three experiments is shown. **(C)**ChIP assay of the relative levels of trimethylated H3K4 (H3K4me3) and H3 acetylation in FLC chromatin. DNA fragments obtained by ChIP were analyzed by real-time PCR. The primer pairs used in PCR are shown as bars below the FLC gene structure; exons are shown as black boxes, introns as black lines, and untranslated regions as dashed boxes. Data are mean ±
sd
of triplicate experiments. (D) Hypothetical model of CYP20-2 and BZR1 function in BR signaling and flowering pathways.
Similar articles
- Brassinosteroid Signaling Recruits Histone 3 Lysine-27 Demethylation Activity to FLOWERING LOCUS C Chromatin to Inhibit the Floral Transition in Arabidopsis.
Li Z, Ou Y, Zhang Z, Li J, He Y. Li Z, et al. Mol Plant. 2018 Sep 10;11(9):1135-1146. doi: 10.1016/j.molp.2018.06.007. Epub 2018 Jun 30. Mol Plant. 2018. PMID: 29969683 - HISTONE DEACETYLASE6 interacts with FLOWERING LOCUS D and regulates flowering in Arabidopsis.
Yu CW, Liu X, Luo M, Chen C, Lin X, Tian G, Lu Q, Cui Y, Wu K. Yu CW, et al. Plant Physiol. 2011 May;156(1):173-84. doi: 10.1104/pp.111.174417. Epub 2011 Mar 10. Plant Physiol. 2011. PMID: 21398257 Free PMC article. - The SUMO E3 ligase, AtSIZ1, regulates flowering by controlling a salicylic acid-mediated floral promotion pathway and through affects on FLC chromatin structure.
Jin JB, Jin YH, Lee J, Miura K, Yoo CY, Kim WY, Van Oosten M, Hyun Y, Somers DE, Lee I, Yun DJ, Bressan RA, Hasegawa PM. Jin JB, et al. Plant J. 2008 Feb;53(3):530-40. doi: 10.1111/j.1365-313X.2007.03359.x. Epub 2007 Dec 6. Plant J. 2008. PMID: 18069938 Free PMC article. - Nitrate Signaling and Its Role in Regulating Flowering Time in Arabidopsis thaliana.
Wang M, Wang J, Wang Z, Teng Y. Wang M, et al. Int J Mol Sci. 2024 May 13;25(10):5310. doi: 10.3390/ijms25105310. Int J Mol Sci. 2024. PMID: 38791350 Free PMC article. Review. - Cyclophilins and Their Functions in Abiotic Stress and Plant-Microbe Interactions.
Olejnik P, Mądrzak CJ, Nuc K. Olejnik P, et al. Biomolecules. 2021 Sep 21;11(9):1390. doi: 10.3390/biom11091390. Biomolecules. 2021. PMID: 34572603 Free PMC article. Review.
Cited by
- Interaction of the Transcription Factors BES1/BZR1 in Plant Growth and Stress Response.
Cao X, Wei Y, Shen B, Liu L, Mao J. Cao X, et al. Int J Mol Sci. 2024 Jun 21;25(13):6836. doi: 10.3390/ijms25136836. Int J Mol Sci. 2024. PMID: 38999944 Free PMC article. Review. - Roles of Brassinosteroids in Plant Reproduction.
Li Z, He Y. Li Z, et al. Int J Mol Sci. 2020 Jan 29;21(3):872. doi: 10.3390/ijms21030872. Int J Mol Sci. 2020. PMID: 32013254 Free PMC article. Review. - The Four FAD-Dependent Histone Demethylases of Arabidopsis Are Differently Involved in the Control of Flowering Time.
Martignago D, Bernardini B, Polticelli F, Salvi D, Cona A, Angelini R, Tavladoraki P. Martignago D, et al. Front Plant Sci. 2019 Jun 4;10:669. doi: 10.3389/fpls.2019.00669. eCollection 2019. Front Plant Sci. 2019. PMID: 31214214 Free PMC article. - GmFLD, a soybean homolog of the autonomous pathway gene FLOWERING LOCUS D, promotes flowering in Arabidopsis thaliana.
Hu Q, Jin Y, Shi H, Yang W. Hu Q, et al. BMC Plant Biol. 2014 Oct 7;14:263. doi: 10.1186/s12870-014-0263-x. BMC Plant Biol. 2014. PMID: 25287450 Free PMC article. - OsFKBP12 transduces the sucrose signal from OsNIN8 to the OsTOR pathway in a loosely binding manner for cell division.
Wang Z, Li H, Weng Y. Wang Z, et al. iScience. 2024 Dec 9;28(1):111555. doi: 10.1016/j.isci.2024.111555. eCollection 2025 Jan 17. iScience. 2024. PMID: 39811636 Free PMC article.
References
- Berardini T.Z., Bollman K., Sun H., Poethig R.S. (2001). Regulation of vegetative phase change in Arabidopsis thaliana by cyclophilin 40. Science 291: 2405–2407 - PubMed
- Bowler C., Benvenuto G., Laflamme P., Molino D., Probst A.V., Tariq M., Paszkowski J. (2004). Chromatin techniques for plant cells. Plant J. 39: 776–789 - PubMed
Publication types
MeSH terms
Substances
LinkOut - more resources
Full Text Sources
Other Literature Sources
Molecular Biology Databases
Miscellaneous


