ER exit sites are physical and functional core autophagosome biogenesis components - PubMed (original) (raw)
ER exit sites are physical and functional core autophagosome biogenesis components
Martin Graef et al. Mol Biol Cell. 2013 Sep.
Abstract
Autophagy is a central homeostasis and stress response pathway conserved in all eukaryotes. One hallmark of autophagy is the de novo formation of autophagosomes. These double-membrane vesicular structures form around and deliver cargo for degradation by the vacuole/lysosome. Where and how autophagosomes form are outstanding questions. Here we show, using proteomic, cytological, and functional analyses, that autophagosomes are spatially, physically, and functionally linked to endoplasmic reticulum exit sites (ERES), which are specialized regions of the endoplasmic reticulum where COPII transport vesicles are generated. Our data demonstrate that ERES are core autophagosomal biogenesis components whose function is required for the hierarchical assembly of the autophagy machinery immediately downstream of the Atg1 kinase complex at phagophore assembly sites.
Figures
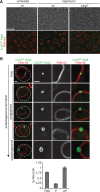
FIGURE 1:
Monitoring autophagosome formation in vivo. (A) Wild-type or Δ_atg7_ cells expressing 2xGFP-ATG8 were grown to log phase in the presence of the vital dye FM4-64 (1 μM) for visualization of vacuolar membranes and treated with rapamycin (400 ng/ml) for 1 h. Cells were imaged using transmission (top) and fluorescence (bottom) microscopy. Single focal planes of representative cells are shown. Scale bar, 7 μm. (B) Wild-type cells expressing 2xGFP-ATG8 were treated as in A and analyzed by fluorescence microscopy. Numbers of PAS, phagophores (P), and autophagosomes (AP) per wild-type cell are shown as mean ± SD of three independent experiments (n = 180 cells). Dashed lines indicate cell boundaries. Scale bars, 1 μm.
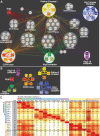
FIGURE 2:
Common interactions of the autophagy and COPII machineries. (A) The physical protein interaction network of autophagy and COPII coat complexes within the functional cluster “vesicle-mediated transport” was generated using total peptide counts. Strains expressing individual, genomically GFP-tagged autophagy and COPII coat components (rounded rectangles) were grown to log phase and treated with rapamycin as described in Figure 1, and physical protein interactions were determined by LC-MS/MS after cell lysis, chemical cross-linking, and immunopurification. Physical protein complexes were determined based on reciprocal and common interactions among complex subunits. For network simplification, interactions of bait proteins of the same complex are shown as single color-coded edges between complex and prey proteins (circles) based on the sum of total peptides. Factors previously implicate in autophagy are labeled in red. (B) Direct physical interactions between the autophagy components and coat components of COPII vesicles. Physical interactions of individual autophagy proteins and COPII coat proteins based on total peptide counts are shown. (C) Pairwise analysis of shared interactions of individual components of the autophagy and COPII machinery within the functional cluster “vesicle-mediated transport.” The number of shared interactions of two bait proteins was counted and expressed as percentage (shades of yellow to red) of total (gray) interactions. Bait proteins are organized and color coded according to physical complexes as shown in A.
FIGURE 3:
Autophagosomes are simultaneously tethered to the vacuole and ER during formation. (A) Wild type cells coexpressing 2xGFP-ATG8 and ER-dsRed were grown to log phase and treated with rapamycin (400 ng/ml) for 1 h and cells were imaged by fluorescence microscopy. Single focal planes of representative cells are shown. (B) Wild-type cells coexpressing 2xGFP-ATG8 and mt-dsRed were treated and analyzed as in A. (C) Relative association of PAS, phagophores, and autophagosomes with cortical, tubular, and nuclear subregions of the ER. (D) Association of PAS, phagophores, and autophagosomes with ER, mitochondria, and vacuoles. Data are shown as mean ± SD of three independent experiments. In total, ≥200 PAS or autophagosomes and ≥23 phagophores were analyzed in C and D. (E) Wild-type cells coexpressing 2xGFP-ATG8, ER-dsRed, and vac-BFP were treated as in A. Cells were imaged using three-dimensional structure illumination microscopy (Nikon 3D-SIM). Dashed lines indicate cell boundaries. P, phagophore; AP, autophagosome. Scale bars, 1 μm (A, B, E).
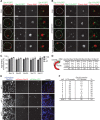
FIGURE 4:
Formation of autophagosomes at ER exit sites is a conserved feature of autophagy. (A, B) Wild-type cells coexpressing Cherry-ATG8 and SEC16-GFP (A) or SEC13-3xGFP (B), respectively, were grown to log phase and treated with rapamycin (400 ng/ml) for 1 h. Cells were analyzed by fluorescence microscopy. Single focal planes of representative cells are shown. Dashed lines indicate cell boundaries. (C) Association of PAS, phagophores, and autophagosomes with ERES, labeled by fluorescent protein fusions of indicated components. Data are shown as mean ± SD of three independent experiments. For each ERES marker ≥150 PAS, ≥35 phagophores (P), and ≥180 autophagosomes (AP) were analyzed. (D) Association of ERES, labeled by fluorescent protein fusions of indicated components, with regions of the phagophore as defined in the schematic. n, number of ERES–phagophore structures analyzed. (E) Cos-7 cells transiently expressing mCitrine-LC3, mCherry-Sec16, and mCerulean-Sec61β were treated with rapamycin (218 ng/ml) for 4–6 h and analyzed by fluorescence microscopy. Peripheral sections of cells 1, 3, and 9 as quantified in F are shown. (F) Quantification of mCitrine-LC3 and mCherry-Sec16 colocalization from nine representative cells treated as described in E. Scale bars, 1 μm (A, B), 3 μm (E).
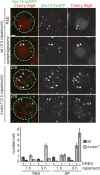
FIGURE 5:
Autophagosome biogenesis is tethered to multiple ER exit sites in yeast cells in the absence of autophagosomal–vacuolar fusion. Wild-type or Δ_vam7_ cells coexpressing Cherry-ATG8 and SEC13-3xGFP were grown to log phase and treated with rapamycin (400 ng/ml) for 1–3 h. Cells were analyzed by fluorescence microscopy at indicated time points. Single or indicated focal planes (z) of representative cells are shown. Examples for ERES–PAS (arrowheads) and ERES–autophagosome (arrows) association, as well as autophagosomes not associated with ERES (double-headed arrows), are indicated. For quantification, ≥90 cells were analyzed for PAS and autophagosome (AP) association with Sec13-3xGFP–marked ERES for each time point and strain as shown in the bar graph. Data are shown as mean ± SD of three independent experiments. Dashed lines indicate cell boundaries. Scale bar, 1 μm.
FIGURE 6:
Function of ER exit sites is required for early stages of autophagosome biogenesis. (A) Wild-type or sec12-4 cells expressing 2xGFP-ATG8 were grown to log phase at permissive temperature (23°C). Cells were treated with rapamycin (400 ng/ml) and shifted to nonpermissive temperature (37°C) for up to 3 h. Cell samples harvested at indicated time points were examined by whole-cell extraction and Western blot analysis using α-GFP (left) or α-Atg13 (right) antibodies. (B) Wild type or sec12-4 cells coexpressing Cherry-ATG8 and SEC13-3xGFP or ATG9-3xGFP, respectively, were grown to log phase at permissive temperature (23°C) and treated for 1 h as described in A. Cells were analyzed by fluorescence microscopy. Quantifications of PAS and autophagosomes (AP) or Atg9 puncta per cell are shown as mean ± SD of three independent experiments (n = 120 cells). Single focal planes of representative cells are shown. Dashed lines indicate cell boundaries. Scale bar, 1 μm.
FIGURE 7:
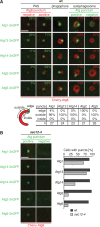
Hierarchical assembly of the autophagy machinery depends on ERES function. (A, B) Wild-type or sec12-4 cells expressing Cherry-ATG8 and ATG1-, ATG13-, ATG14-, ATG2-, or ATG5-3xGFP were grown to log phase at permissive temperature (23°C), treated with rapamycin (400 ng/ml), and shifted to nonpermissive temperature (37°C) for 1 h and analyzed by fluorescence microscopy. Single focal planes of sections of representative cells are shown. (A) Association of indicated Atgs with PAS or autophagosomes marked by Cherry-Atg8 is shown in percentage (n ≥ 100). Associations of Atgs, labeled by fluorescent protein fusions of indicated components, with regions of the phagophore as defined in the schematic are shown. n, number of Atg-phagophore structures analyzed. (B) sec12-4 cells without Cherry-Atg8–marked structures were analyzed for punctate structures formed by indicated autophagy components. Left, single focal planes of sections of example cells. The bar graph shows the number of total wild-type cells displaying punctate structures of indicated Atgs compared with the number of sec12-4 cells showing punctate Atgs not marked by Cherry-Atg8 (n ≥ 100). Scale bars, 1 μm.
FIGURE 8:
Model for the functional specialization of the ER for autophagosomal biogenesis. 1) Initiation: on autophagy induction, the Atg1 kinase complex localizes to PAS. 2) Phagophore nucleation: coinciding with recruitment of Atg14, ERES generate COPII-derived membrane compartments that function as pre-phagophore membranes and/or as structural platforms for Atg9-driven phagophore assembly (A). Alternatively, fusion of ERES-dependent COPII vesicles with pre-phagophores derived from Atg9 vesicles drives phagophore maturation (B). 3, 4) Phagophore expansion is initiated by Atg2-18 complex, Atg5-12/16 complex, and Atg8 recruitment and is driven by the fusion of COPII vesicle and potentially other membrane sources at the edge of cup-shaped phagophores. Expansion of the phagophore separates the autophagy machinery into at least two distinct groups: the Atg2-18 complex is associated with ERES at the edge; other components remain at punctate structures in proximity to the vacuole. Phagophores are tethered simultaneously to ERES and vacuoles by separate tethering structures. 5, 6) On completion, autophagy components dissociate, and mature autophagosomes are released from ERES tethers and fuse with vacuolar membranes in a temporally coordinated manner.
References
- Babu M, Krogan NJ, Awrey de Emili A, Greenblatt JF. Systematic characterization of the protein interaction network and protein complexes in Saccharomyces cerevisiae using tandem affinity purification and mass spectrometry. Methods Mol Biol. 2009;548:187–207. - PubMed
- Barlowe C, Schekman R. SEC12 encodes a guanine-nucleotide-exchange factor essential for transport vesicle budding from the ER. Nature. 1993;365:347–349. - PubMed
Publication types
MeSH terms
Grants and funding
- R01 GM097432/GM/NIGMS NIH HHS/United States
- R01 GM062942/GM/NIGMS NIH HHS/United States
- R01GM097432/GM/NIGMS NIH HHS/United States
- MOP-125952/CAPMC/ CIHR/Canada
- R01GM062942/GM/NIGMS NIH HHS/United States
LinkOut - more resources
Full Text Sources
Other Literature Sources
Molecular Biology Databases
Research Materials
