Autophagy suppresses tumorigenesis of hepatitis B virus-associated hepatocellular carcinoma through degradation of microRNA-224 - PubMed (original) (raw)
Autophagy suppresses tumorigenesis of hepatitis B virus-associated hepatocellular carcinoma through degradation of microRNA-224
Sheng-Hui Lan et al. Hepatology. 2014 Feb.
Free PMC article
Abstract
In hepatocellular carcinoma (HCC), dysregulated expression of microRNA-224 (miR-224) and impaired autophagy have been reported separately. However, the relationship between them has not been explored. In this study we determined that autophagy is down-regulated and inversely correlated with miR-224 expression in hepatitis B virus (HBV)-associated HCC patient specimens. These results were confirmed in liver tumors of HBV X gene transgenic mice. Furthermore, miR-224 was preferentially recruited and degraded during autophagic progression demonstrated by real-time polymerase chain reaction and miRNA in situ hybridization electron microscopy after extraction of autophagosomes. Our in vitro study demonstrated that miR-224 played an oncogenic role in hepatoma cell migration and tumor formation through silencing its target gene Smad4. In HCC patients, the expression of low-Atg5, high-miR-224, and low-Smad4 showed significant correlation with HBV infection and a poor overall survival rate. Autophagy-mediated miR-224 degradation and liver tumor suppression were further confirmed by the autophagy inducer amiodarone and miR-224 antagonist using an orthotopic SD rat model.
Conclusion: A noncanonical pathway links autophagy, miR-224, Smad4, and HBV-associated HCC. These findings open a new avenue for the treatment of HCC.
Copyright © 2013 The Authors. HEPATOLOGY published by Wiley on behalf of the American Association for the Study of Liver Diseases.
Figures
Figure 1
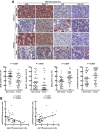
Low autophagic level and high miR-224 expression correlate with HBV-associated HCC. (A) Representative IHC of two paired HBV-associated HCC specimens showing the staining of Atg5, Beclin 1, and p62. MiR-224 staining was shown by miRNA in situ hybridization. Protein and miR-224 expression were determined by defining regions of interest (ROIs) using automated cell acquisition and quantification software (Histoquest). Arrow points to p62 accumulation. Scale bar = 20 μm. Quantification of the expression levels of Atg5, Beclin 1, p62, and miR-224 in 46 paired HBV-associated HCC specimens is shown as graphs. (B) Correlation of miR-224 expression with Atg5 and p62 was analyzed in 46 paired HBV-associated HCC specimens and linear regression coefficient and statistical significance are indicated. N, adjacent nontumor tissue; T, tumor tissue.
Figure 2
Liver tumor formation in HBx transgenic mice is correlated with low autophagic level and high miR-224 expression. (A) Liver without tumor was from 6-month-old transgenic mice (6 M), and liver with tumor was from 17.5-month-old transgenic mice (17.5 M). The arrow points to the tumor. Scale bar = 1 cm. (B) Representative IHC showing the staining of Atg5 and p62 in paraffin section including liver tissue without tumor formation of 6-month-old transgenic mice, liver tumor tissue and adjacent nontumor tissue of 17.5-month-old transgenic mice. Arrow points to p62 accumulation. Scale bar = 20 μm. Atg5 and p62 expression levels were determined by ROI followed by HistoQuest analysis. Quantification of the expression levels of Atg5 and p62 in transgenic mice are shown as bar graphs. (C) Quantification of miR-224 expression in HBx transgenic mice by real-time PCR and data are shown as mean ± SEM (n = 5). The relative expression fold of miR-224 is normalized to snoRNA-55. **P < 0.01 and ***P < 0.001. N, adjacent nontumor tissue; T, tumor tissue.
Figure 3
Autophagic flux participates in the degradation of mature miR-224 expression. (A) Quantification of the expression of precursor and mature forms miR-224 in 75 paired HCC specimens by real-time PCR. (B) Hep 3B cells were treated with amiodarone (5 μM) for various times. The expression of LC3 and p62 was determined by western blotting. Beta-actin was used as an internal control. (C) MiR-224 expression in cells in (B) was measured by real-time PCR. (D) Amiodarone-induced autophagic flux was blocked by CQ. Hep 3B cells were treated with amiodarone (5 μM) for 48 hours. In the CQ group, CQ (50 μM) was added at 24 hours in the presence or absence of amiodarone treatment for another 24 hours. LC3 expression was determined by western blotting. (E) MiR-224 expression in (D) was determined by real-time PCR. The data are shown as mean ± SEM (n = 3). The relative expression fold of miR-224 is normalized to U54. P values were obtained using a paired Student t test. *P < 0.05 and **P < 0.01. Pre-miR 224, precursor miR-224; CQ, chloroquine.
Figure 4
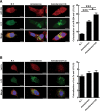
MiR-224 is accumulated in the autophagosome but not let-7a. MiR-224 accumulation in the autophagosome was demonstrated by CQ blockage. Hep 3B cells were treated with amiodarone (5 μM) for 24 hours followed by CQ (50 μM) blockage for another 24 hours. The LC3 protein was labeled with green fluorescent tag. MiR-224 and let-7a were labeled with red fluorescent tags. The arrows point to colocalization of LC3 and miR-224 (A) or LC3 and let-7a (B). Scale bar = 10 μm. Quantification of colocalization was performed by counting 30 cells. *P < 0.05 and ***P < 0.001. N.T., nontreatment; CQ, chloroquine.
Figure 5
Preferential accumulation of miR-224 was demonstrated in the autophagosome. Hep 3B cells were treated with amiodarone and chloroquine (CQ) as in Fig. 4A. Protein and RNA were extracted from the whole cell lysate and followed by autophagosome purification. (A) Protein was analyzed by western blotting for LC3, Hsp 60 (mitochondria marker), and calreticulin (endoplasmic reticulum marker) expression. (B) The quantification of miR-224 and let-7a conducted by real-time PCR is shown as mean ± SEM (n = 5). (C) Accumulation of immune-gold labeled miR-224 (18 nm gold beads) in the purified double membrane autophagosomes was detected by miRNA in situ hybridization under TEM. (D) Accumulation of immune-gold labeled let-7a (18 nm gold beads) in the autophagosomes. The arrows highlight gold labeled miR-224 in (C) and let-7a in (D). Scale bar = 100 nm. (E) Quantification was performed by counting the gold particle labeled miR-224 and let-7a in 50 autophagosomes. WC, whole cell lysate; AP, autophagosome fraction.
Figure 6
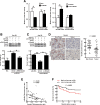
MiR-224 promotes tumor formation through silencing Smad4, and together with impaired autophagy correlates with poor overall survival rate. (A) HEK293T cells were transfected with wild-type or mutant-type pMIR-Report-Smad4 plasmid and cotransfected with miR-224, miR-224 antagonist (anti-miR-224) or their negative controls (N.C. and anti-N.C.), individually. The luciferase activity was determined and normalized with Renilla luciferase activity of plasmid pRL-TK. Quantification of the data is shown as mean ± SEM (n = 5). (B) Hep 3B cells were transfected with N.C. or miR-224. The cells with miR-224 were cotransfected with pRK5-Smad4 or control vector plasmids. (C) Similarly, Hep 3B cells were transfected with anti-N.C. or anti-miR-224. The cells with anti-miR-224 were cotransfected with si-Smad4 or si-RNA negative control (si-N.C.). The protein expression of Smad4 and β-actin was determined by western blotting. The transfected cells were injected subcutaneously into NOD/SCID mice (n = 5) for 14 days and the quantification of the tumors is shown in (B,C). (D) Two representative IHC staining of Smad4 expression from 46 paired HBV-associated HCC specimens. The analysis and quantification of protein expression are the same as in Fig. 1A. Scale bar = 20 μm. P values were obtained using a paired Student t test. (E) Correlation of Smad4 expression with miR-224 was analyzed using 46 paired HBV-associated HCC specimens and linear regression coefficient and statistical significance are indicated. N, adjacent nontumor tissue; T, tumor tissue. (F) The survival rates were determined by Kaplan-Meier analysis of HCC patients 4 years after surgery. P values were obtained by log rank test. High-risk group: low-Atg5, high-miR-224, and low-Smad4 expression in the HCC tumor parts compared to the adjacent nontumor parts. The remaining specimens are defined as the low-risk group. *P < 0.05 and **P < 0.01.
Figure 7
Liver tumors are suppressed by manipulation level of autophagy or miR-224 expression in an orthotopic rat model. In the former group, rat N1-S1 hepatoma cells were orthotopically injected into the rat livers, followed by intraperitoneal injection of DDW or amiodarone (30 mg/kg). In the latter group, rat N1-S1 cells were transfected with miR-224 antagonist (anti-miR-224) or negative control (anti-N.C), and injected into the rats’ livers. (A) Rats were sacrificed to collect the livers 1 week after orthotopic injection. The arrows point to tumors in the liver, and five mice were used in each group. Tumor formation was quantified by measuring the tumor weight. (B) Protein was extracted from the tumors of the former group, and the expression of LC3, Smad4 and β-actin was determined by western blotting. (C,D) Tumor sections of DDW (C) or amiodarone (D) treatment were further examined under TEM. Scale bar = 2 μm; White boxes in (C,D) are further enlarged. Scale bar = 500 nm. The arrows point the autophagosomes. N, nucleus. (E) The expression of miR-224 in the tumors after various treatments was evaluated by real-time PCR. Quantification of miR-224 expression is shown as mean ± SEM (n = 5). P values were obtained by Student t test. *P < 0.05 and **P < 0.01.
Figure 8
A schematic hypothetical model of autophagy regulation of miR-224 and reduction of autophagy is associated with high miR-224 expression in HBV-related HCC. (A) The mature form miR-224 is preferentially recruited into the autophagosome and proceeds with fusion with lysosome to form autolysosome, in which miR-224 was degraded. (B) Low level of autophagy occurs during HBV-associated HCC development demonstrated by low expression of autophagy-related genes (Atg5, Beclin 1) and accumulation of p62 protein through an undermined mechanism. Low autophagic activity may play a pivotal role in miR-224 overexpression, which promotes cell migration and tumor formation through silencing Smad4 protein expression.
Similar articles
- MicroRNA-98-5p Inhibits Tumorigenesis of Hepatitis B Virus-Related Hepatocellular Carcinoma by Targeting NF-κB-Inducing Kinase.
Fei X, Zhang P, Pan Y, Liu Y. Fei X, et al. Yonsei Med J. 2020 Jun;61(6):460-470. doi: 10.3349/ymj.2020.61.6.460. Yonsei Med J. 2020. PMID: 32469170 Free PMC article. - miR-106b promotes cancer progression in hepatitis B virus-associated hepatocellular carcinoma.
Yen CS, Su ZR, Lee YP, Liu IT, Yen CJ. Yen CS, et al. World J Gastroenterol. 2016 Jun 14;22(22):5183-92. doi: 10.3748/wjg.v22.i22.5183. World J Gastroenterol. 2016. PMID: 27298561 Free PMC article. - HBV suppresses ZHX2 expression to promote proliferation of HCC through miR-155 activation.
Song X, Tan S, Wu Z, Xu L, Wang Z, Xu Y, Wang T, Gao C, Gong Y, Liang X, Gao L, Spear BT, Ma C. Song X, et al. Int J Cancer. 2018 Dec 15;143(12):3120-3130. doi: 10.1002/ijc.31595. Epub 2018 Oct 4. Int J Cancer. 2018. PMID: 29752719 - Hepatitis B virus and microRNAs: Complex interactions affecting hepatitis B virus replication and hepatitis B virus-associated diseases.
Lamontagne J, Steel LF, Bouchard MJ. Lamontagne J, et al. World J Gastroenterol. 2015 Jun 28;21(24):7375-99. doi: 10.3748/wjg.v21.i24.7375. World J Gastroenterol. 2015. PMID: 26139985 Free PMC article. Review. - Autophagy and microRNA in hepatitis B virus-related hepatocellular carcinoma.
Wu SY, Lan SH, Liu HS. Wu SY, et al. World J Gastroenterol. 2016 Jan 7;22(1):176-87. doi: 10.3748/wjg.v22.i1.176. World J Gastroenterol. 2016. PMID: 26755869 Free PMC article. Review.
Cited by
- Small but Heavy Role: MicroRNAs in Hepatocellular Carcinoma Progression.
Chen E, Xu X, Liu R, Liu T. Chen E, et al. Biomed Res Int. 2018 May 22;2018:6784607. doi: 10.1155/2018/6784607. eCollection 2018. Biomed Res Int. 2018. PMID: 29951542 Free PMC article. Review. - Autophagy: The multi-purpose bridge in viral infections and host cells.
Abdoli A, Alirezaei M, Mehrbod P, Forouzanfar F. Abdoli A, et al. Rev Med Virol. 2018 Jul;28(4):e1973. doi: 10.1002/rmv.1973. Epub 2018 Apr 30. Rev Med Virol. 2018. PMID: 29709097 Free PMC article. Review. - MicroRNAs associated with HBV infection and HBV-related HCC.
Xie KL, Zhang YG, Liu J, Zeng Y, Wu H. Xie KL, et al. Theranostics. 2014 Sep 19;4(12):1176-92. doi: 10.7150/thno.8715. eCollection 2014. Theranostics. 2014. PMID: 25285167 Free PMC article. Review. - MicroRNAs Expressed during Viral Infection: Biomarker Potential and Therapeutic Considerations.
Louten J, Beach M, Palermino K, Weeks M, Holenstein G. Louten J, et al. Biomark Insights. 2016 Jan 18;10(Suppl 4):25-52. doi: 10.4137/BMI.S29512. eCollection 2015. Biomark Insights. 2016. PMID: 26819546 Free PMC article. Review. - The effect of miRNA and autophagy on colorectal cancer.
Long J, He Q, Yin Y, Lei X, Li Z, Zhu W. Long J, et al. Cell Prolif. 2020 Oct;53(10):e12900. doi: 10.1111/cpr.12900. Epub 2020 Sep 10. Cell Prolif. 2020. PMID: 32914514 Free PMC article. Review.
References
- Budhu A, Forgues M, Ye QH, Jia HL, He P, Zanetti KA, et al. Prediction of venous metastases, recurrence, and prognosis in hepatocellular carcinoma based on a unique immune response signature of the liver microenvironment. Cancer Cell. 2006;10:99–111. - PubMed
- Aravalli RN, Steer CJ, Cressman EN. Molecular mechanisms of hepatocellular carcinoma. Hepatology. 2008;48:2047–2063. - PubMed
- Ding ZB, Shi YH, Zhou J, Qiu SJ, Xu Y, Dai Z, et al. Association of autophagy defect with a malignant phenotype and poor prognosis of hepatocellular carcinoma. Cancer Res. 2008;68:9167–9175. - PubMed
Publication types
MeSH terms
Substances
LinkOut - more resources
Full Text Sources
Other Literature Sources
Medical
Miscellaneous


