Peritoneal cavity regulatory B cells (B10 cells) modulate IFN-γ+CD4+ T cell numbers during colitis development in mice - PubMed (original) (raw)
Peritoneal cavity regulatory B cells (B10 cells) modulate IFN-γ+CD4+ T cell numbers during colitis development in mice
Damian Maseda et al. J Immunol. 2013.
Abstract
The spleen regulatory B cell subset with the functional capacity to express IL-10 (B10 cells) modulates both immune responses and autoimmune disease severity. However, the peritoneal cavity also contains relatively high frequencies of functionally defined IL-10-competent B10 cells. In this study, peritoneal cavity B10 cells shared similar cell surface phenotypes with their spleen counterparts. However, peritoneal cavity B10 cells were 10-fold more frequent among B cells than occurred within the spleen, intestinal tract, or mesenteric lymph nodes and were present at higher proportions among the phenotypically defined peritoneal B1a > B1b > B2 cell subpopulations. The development or localization of B10 cells within the peritoneal cavity was not dependent on the presence of commensal microbiota, T cells, IL-10 or B10 cell IL-10 production, or differences between their fetal liver or adult bone marrow progenitor cell origins. The BCR repertoire of peritoneal cavity B10 cells was diverse, as occurs in the spleen, and predominantly included germline-encoded VH and VL regions commonly found in either the conventional or B1 B cell compartments. Thereby, the capacity to produce IL-10 appears to be an intrinsic functional property acquired by clonally diverse B cells. Importantly, IL-10 production by peritoneal cavity B cells significantly reduced disease severity in spontaneous and induced models of colitis by regulating neutrophil infiltration, colitogenic CD4(+) T cell activation, and proinflammatory cytokine production during colitis onset. Thus, the numerically small B10 cell subset within the peritoneal cavity has regulatory function and is important for maintaining homeostasis within gastrointestinal tissues and the immune system.
Figures
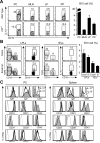
Figure 1. Peritoneal B cell IL-10 production
(A) IL-10 expression by CD19+ B cells within the peritoneal cavity (PC), mesenteric lymph nodes (MLN), colonic lamina propria (LP), and Peyer's patches (PP). B cells isolated from either wild type or IL-10−/− mice were stimulated ex vivo with LPS, PMA, ionomycin and monensin (L+PIM) for 5 h before cell surface CD19 and cytoplasmic IL-10 immunofluorescence staining with flow cytometry analysis. Positive IL-10 gating was established using IL-10−/− or wild type B cells that were incubated with monensin alone with similar results. Numbers indicate cell frequencies within the indicated gates. Bar graphs show mean (±SEM) IL-10-competent B cell frequencies (n=4-8 mice per group). (B) The lamina propria (LP) and intraepithelial lymphocyte (IEL) subsets include B10 cells. IL-10+CD19+ B cells were identified as in (A) among B cell subsets isolated from the colon and small intestine. Bar graphs show mean (±SEM) IL-10-competent B cell frequencies (n=4 mice per group). Differences between tissues were not significant. (C) Peritoneal cavity and spleen IL-10+ B cell phenotypes. IL-10+CD19+ B cells identified as in (A) are shown (thick empty lines) in comparison with IL-10−CD19+ B cells (thin shaded histograms) and background control mAb staining (dotted lines). MHC class II (MHCII). Histograms represent results from ≥3 mice.
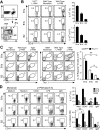
Figure 2. IL-10 expression by phenotypically-defined peritoneal cavity B cell subsets
(A) Representative gating used for the identification of CD19+ B cells with B1a (CD5+CD11b+), B1b (CD5+CD11b−), or B2 (CD5−CD11b−) cell phenotypes during flow cytometry analysis. Cell frequencies within the indicated gates are shown. Histograms represent results from ≥3 mice. (B) IL-10 expression by B cells with B1a, B1b or B2 cell phenotypes. IL-10-competent B cell frequencies and numbers were determined following L+PIM stimulation for 5 h, followed by cell surface molecule and cytoplasmic IL-10 staining before flow cytometry analysis. B cells from IL-10−/− mice or B cells cultured in monensin alone were used as controls for background IL-10 staining. Bar graphs show mean (±SEM) frequencies and numbers of IL-10-competent B cells (n=10 mice). (C) Representative IL-10 expression by B cells with B1a, B1b or B2 cell phenotypes in IL-10 reporter Tiger (eGFP reporter) and 10BiT (Thy1.1 reporter) mice in comparison with wild type mice shown as negative controls for reporter expression. B cells were stained for intracellular IL-10 and GFP for Tiger mice or Thy1.1 for 10BiT mice following 5 h of culture with monensin only or L+PIM. Bar graphs show mean (±SEM) reporter-positive cell numbers (n=8 mice). Significant differences between sample means are shown; *p <0.05, **p<0.01. (D) Influence of CD40, TLR, and BCR signaling on IL-10 expression. Purified B cells with B1a, B1b or B2 cell phenotypes were cultured in medium alone or containing agonistic CD40 mAb, LPS, or anti-IgM antibody for 43 h. The culture supernatant fluid was harvested for ELISA and the cells were then cultured with monensin or L+PIM for an additional 5 h. Representative contour plots for intracellular IL-10 expression by CD19+ B cells are shown. Bar graphs show IL-10-competent B cell frequencies after monensin or L+PIM stimulation and IL-10 concentrations in tissue culture supernatant fluid. Data are pooled from two experiments using three to four mice/group. Differences between values for each group are significant (p<0.05), except where noted as non-significant (n.s.).
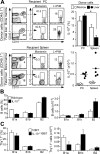
Figure 3. IL-10 competence is independent of B cell precursor populations and IL-10
(A) IL-10 competence is independent of precursor B cell origin. Bone marrow and fetal liver hematopoietic cells from congenic CD45.1 transgenic donor mice were transferred i.v. into recipient _Rag2_−/− mice. Six weeks later, CD45.1+CD19+ B10 cells within the peritoneal cavity and spleen of recipient mice were quantified. Bar graphs show mean (±SEM) B10 cell frequencies and numbers from four recipient _Rag2_−/− mice in two experiments. Significant differences between sample means are indicated: * p<0.05. (B) Peritoneal cavity B cell subsets develop normally in IL-10−/− mice. B cells isolated from 10-12 week-old wild type or IL-10−/− littermates were stimulated with L+PIM for 5 h before immunofluorescence staining with flow cytometry analysis. Bar graphs indicate mean (±SEM) frequencies or numbers of B cells with B1a, B1b or B2 phenotypes (n=8 mice in two experiments). (C) IL-10 is not required for peritoneal cavity B10 cell development in 10BiT mice. B cells isolated from 10-12 week-old 10BiT or IL-10−/−10BiT littermates were stimulated with L+PIM for 5 h before immunofluorescence staining with flow cytometry analysis. Bar graphs indicate mean (±SEM) frequencies or numbers of IL-10+ cells among B cells with B1a, B1b or B2 phenotypes (n=3-4 mice/group).
Figure 4. B cell IL-10 production is not regulated by microbiota or anatomic location
(A) B10 cell development in gnotobiotic and specific pathogen-free (SPF) mice (6 mo-old; 129S6/SvEv strain). Representative flow cytometry histograms of peritoneal cavity and spleen B cells are shown. Bar graphs show mean (±SEM) B10 cell frequencies and numbers (n=3 mice/group). (B) The peritoneal cavity environment does not induce B10 cell expansion in C57BL/6 mice. Purified peritoneal cavity and spleen CD19+ B cells were CFSE-labeled and transferred i.p. into untreated recipient mice. After 72 h, peritoneal cavity B10 cell frequencies among CFSE+CD19+ B cells and numbers were quantified. Representative contour plots and percentages of CFSE+ B cells are shown. Bar graphs show mean (±SEM) B10 cell frequencies and numbers (n=4 mice) from one of two experiments with similar results. (C) IL-10-competent B cells reconstitute both the spleen and peritoneal cavity of _Rag2_−/− mice given PBS (control), or equal numbers of purified peritoneal cavity CD11b+CD19+ or spleen CD5+CD1dhiCD19+ B cells i.v. Two weeks later, IL-10-competent B cell frequencies and numbers among transferred B cells within the peritoneal cavity and spleen of recipient mice were quantified. Representative contour plots and percentages of cells within the indicated gates are shown. Bar graphs show mean (±SEM) B10 cell frequencies and numbers from three recipient _Rag2_−/− mice in two experiments. (B-C) Significant differences between sample means are shown; *p<0.05, **p<0.01.
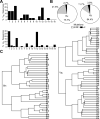
Figure 5. Peritoneal cavity B10 cells utilize diverse V genes that are largely unmutated
(A) VH family gene usage by 36 IL-10+ B cells and VK family gene usage by 81 IL-10+ B cells from two individual mice. (B) Mutation frequencies within the VH-D-JH and VK-JK gene sequences. (C) Phylogenetic trees showing relationships between the VH-D-JH (n=36) or VK-JK (n=50) amino acid sequences of individual B cells from individual mice named A or B with numbers indicating different B cells. Branches indicate the average distance between two sequences based on percent identity.
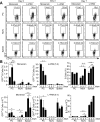
Figure 6. B10 effector cell IL-10 expression during DSS-induced intestinal injury
(A) B cells in Tiger mice express GFP during acute DSS-induced gut inflammation. Peritoneal cavity, mesenteric lymph node and spleen B cells were isolated from Tiger mice before (day zero) or three or seven days after DSS treatment and were cultured with either monensin or L+PIM for 5 h. Cell surface CD19 and cytoplasmic GFP expression were analyzed by flow cytometry. Mean (± SEM) GFP+ cell frequencies among CD19+ B cells are shown for three mice per group. (B) B10 effector cell frequencies and numbers during DSS-induced intestinal injury as measured in (A). Significant differences between sample means are shown; *p<0.05, **p<0.01.
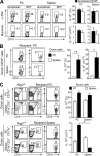
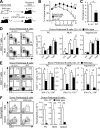
Figure 7. B10 cells regulate spontaneous colitis onset in IL-10−/− mice
(A) Scheme for the transfer of peritoneal cavity CD19+ B cells from wild type (WT) or IL-10−/− mice into IL-10−/− mice i.p. at 10-12 weeks of age. (B-C) Adoptively transferred peritoneal cavity B cells from wild type mice prevent weight loss and reduce colitis severity in IL-10−/− mice. (B) Weight loss values represent mean (± SEM) results from 20 recipient mice/group during weeks 1-6 and 12 recipient mice/group at week 16 after euthanasia of mice with >20% weight loss. (C) Mean histological scores (± SEM) were obtained 16 weeks after adoptive transfers in four to six representative recipient mice/group from four experiments. (D-E) Adoptively transferred peritoneal cavity B cells from wild type mice reduce CD4+ T cell activation and IFN-γ expression in recipient IL-10−/− mice. (D) Representative peritoneal cavity and inguinal lymph node dot plots and bar graphs show mean frequencies and numbers (± SEM) of total, naïve (CD44−CD62L+) and activated (CD44+CD62L−) CD4+ T cells eight weeks after adoptive transfers with nine recipient mice/group from three experiments. (E) Representative CD4+ T cell cytoplasmic IFN-γ and IL-17A production measured after CD3ε/CD28 mAb stimulation in the presence of Brefeldin A for 4 h. Bar graphs indicate means (±SEM) of eight recipient mice/group from three experiments. (F) Transferred peritoneal cavity B cells from wild type mice reduce neutrophil localization within recipient IL-10−/− mouse tissues. Representative histograms show tissue CD11b+Ly6G+ neutrophil frequencies 16 weeks after adoptive transfers. All CD19+ and TCRβ+ lymphocytes were excluded (“gated out”) from the mononuclear cell preparations for the analysis. Values indicate mean (±SEM) neutrophil frequencies (contour plots) and numbers from seven recipient mice/group in two experiments. (B-F) Significant differences between sample means are indicated; *p<0.05, **p<0.01.
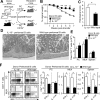
Figure 8. B cell IL-10 regulates T cell-induced colitis in _Rag2_−/− mice
(A) Scheme for the i.p. co-transfer of peritoneal cavity CD19+ B cells from wild type (WT) or IL-10−/− mice along with spleen CD25−CD45RBhiCD4+ T cells from wild type mice into _Rag2_−/− mice. (B-D) Adoptively transferred peritoneal cavity B cells from wild type mice reduce weight loss and colitis severity. (B) Values represent means (± SEM) of 12 recipient mice/group from five experiments. (C) Mean histological scores (± SEM) were obtained seven to eight weeks after adoptive transfers in four to six representative recipient mice/group from four experiments. (D) Representative histologies from mice given either wild type or IL-10−/− B cells as in (C). (E-F) Transferred peritoneal cavity B cells from wild type mice do not significantly affect peritoneal cavity and mesenteric lymph node CD4+ T cell numbers but reduce CD4+ T cell IFN-γ and IL-17A expression in recipient _Rag2_−/− mice. T cell cytoplasmic cytokine production was measured seven to eight weeks after adoptive transfers following CD3ε/CD28 mAb stimulation in the presence of Brefeldin A for 4 h. Representative contour plots are shown. Bar graphs indicate mean (± SEM) CD4+ T cell numbers of eight recipient mice/group from three experiments. (B-D) Significant differences between sample means are indicated; *p<0.05, **p<0.01.
Similar articles
- TLR9 mediated regulatory B10 cell amplification following sub-total body irradiation: Implications in attenuating EAE.
Hong J, Fang J, Lan R, Tan Q, Tian Y, Zhang M, Okunieff P, Zhang L, Lin J, Han D. Hong J, et al. Mol Immunol. 2017 Mar;83:52-61. doi: 10.1016/j.molimm.2017.01.011. Epub 2017 Jan 18. Mol Immunol. 2017. PMID: 28110075 - Activated peritoneal cavity B-1a cells possess regulatory B cell properties.
Margry B, Kersemakers SC, Hoek A, Arkesteijn GJ, Wieland WH, van Eden W, Broere F. Margry B, et al. PLoS One. 2014 Feb 13;9(2):e88869. doi: 10.1371/journal.pone.0088869. eCollection 2014. PLoS One. 2014. PMID: 24551182 Free PMC article. - Dynamic Number and Function of IL-10-Producing Regulatory B Cells in the Immune Microenvironment at Distinct Stages of Type 1 Diabetes.
Jiang R, Qin Y, Wang Y, Xu X, Chen H, Xu K, Zhang M. Jiang R, et al. J Immunol. 2022 Mar 1;208(5):1034-1041. doi: 10.4049/jimmunol.2100357. Epub 2022 Feb 9. J Immunol. 2022. PMID: 35140133 - Regulatory B10 cell development and function.
Lykken JM, Candando KM, Tedder TF. Lykken JM, et al. Int Immunol. 2015 Oct;27(10):471-7. doi: 10.1093/intimm/dxv046. Epub 2015 Aug 6. Int Immunol. 2015. PMID: 26254185 Free PMC article. Review. - Regulatory B and T cell responses in patients with autoimmune thyroid disease and healthy controls.
Kristensen B. Kristensen B. Dan Med J. 2016 Feb;63(2):B5177. Dan Med J. 2016. PMID: 26836805 Review.
Cited by
- Immunosuppressive Mechanisms of Regulatory B Cells.
Catalán D, Mansilla MA, Ferrier A, Soto L, Oleinika K, Aguillón JC, Aravena O. Catalán D, et al. Front Immunol. 2021 Apr 29;12:611795. doi: 10.3389/fimmu.2021.611795. eCollection 2021. Front Immunol. 2021. PMID: 33995344 Free PMC article. Review. - Intraperitoneally Delivered Mesenchymal Stem Cells Alleviate Experimental Colitis Through THBS1-Mediated Induction of IL-10-Competent Regulatory B Cells.
Liu J, Lai X, Bao Y, Xie W, Li Z, Chen J, Li G, Wang T, Huang W, Ma Y, Shi J, Zhao E, Xiang AP, Liu Q, Chen X. Liu J, et al. Front Immunol. 2022 Mar 18;13:853894. doi: 10.3389/fimmu.2022.853894. eCollection 2022. Front Immunol. 2022. PMID: 35371051 Free PMC article. - Immunoregulation by antibody secreting cells in inflammation, infection, and cancer.
McGettigan SE, Debes GF. McGettigan SE, et al. Immunol Rev. 2021 Sep;303(1):103-118. doi: 10.1111/imr.12991. Epub 2021 Jun 17. Immunol Rev. 2021. PMID: 34145601 Free PMC article. Review. - IL-10 Production Is Critical for Sustaining the Expansion of CD5+ B and NKT Cells and Restraining Autoantibody Production in Congenic Lupus-Prone Mice.
Baglaenko Y, Manion KP, Chang NH, Gracey E, Loh C, Wither JE. Baglaenko Y, et al. PLoS One. 2016 Mar 10;11(3):e0150515. doi: 10.1371/journal.pone.0150515. eCollection 2016. PLoS One. 2016. PMID: 26964093 Free PMC article. - JMJD family proteins in cancer and inflammation.
Manni W, Jianxin X, Weiqi H, Siyuan C, Huashan S. Manni W, et al. Signal Transduct Target Ther. 2022 Sep 1;7(1):304. doi: 10.1038/s41392-022-01145-1. Signal Transduct Target Ther. 2022. PMID: 36050314 Free PMC article. Review.
References
- Abraham C, Cho J. Interleukin-23/Th17 pathways and inflammatory bowel disease. Inflamm. Bowel Dis. 2009;15:1090–1100. - PubMed
- Nemoto Y, Kanai T, Kameyama K, Shinohara T, Sakamoto N, Totsuka T, Okamoto R, Tsuchiya K, Nakamura T, Sudo T, Matsumoto S, Watanabe M. Long-lived colitogenic CD4+ memory T cells residing outside the intestine participate in the perpetuation of chronic colitis. J. Immunol. 2009;183:5059–5068. - PubMed
- Asseman C, Read S, Powrie F. Colitogenic Th1 cells are present in the antigen-experienced T cell pool in normal mice: control by CD4+ regulatory T cells and IL-10. J. Immunol. 2003;171:971–978. - PubMed
- Moore KW, de Waal Malefyt R, Coffman RL, O'Garra A. Interleukin-10 and the interleukin-10 receptor. Annu. Rev. Immunol. 2001;19:683–765. - PubMed
Publication types
MeSH terms
Substances
Grants and funding
- DK054452/DK/NIDDK NIH HHS/United States
- P30 CA016086/CA/NCI NIH HHS/United States
- AI56363/AI/NIAID NIH HHS/United States
- AI057157/AI/NIAID NIH HHS/United States
- U19 AI056363/AI/NIAID NIH HHS/United States
- R01 DK054452/DK/NIDDK NIH HHS/United States
- U54 AI057157/AI/NIAID NIH HHS/United States
LinkOut - more resources
Full Text Sources
Other Literature Sources
Molecular Biology Databases
Research Materials
