Super-resolution imaging reveals that AMPA receptors inside synapses are dynamically organized in nanodomains regulated by PSD95 - PubMed (original) (raw)
Super-resolution imaging reveals that AMPA receptors inside synapses are dynamically organized in nanodomains regulated by PSD95
Deepak Nair et al. J Neurosci. 2013.
Abstract
The spatiotemporal organization of neurotransmitter receptors in postsynaptic membranes is a fundamental determinant of synaptic transmission and information processing by the brain. Using four independent super-resolution light imaging methods and EM of genetically tagged and endogenous receptors, we show that, in rat hippocampal neurons, AMPARs are often highly concentrated inside synapses into a few clusters of ∼70 nm that contain ∼20 receptors. AMPARs are stabilized reversibly in these nanodomains and diffuse freely outside them. Nanodomains are dynamic in their shape and position within synapses and can form or disappear within minutes, although they are mostly stable for up to 1 h. AMPAR nanodomains are often, but not systematically, colocalized with clusters of the scaffold protein PSD95, which are generally of larger size than AMPAR nanoclusters. PSD95 expression level regulates AMPAR nanodomain size and compactness in parallel to miniature EPSC amplitude. Monte Carlo simulations further indicate the impact of AMPAR concentration in clusters on the efficacy of synaptic transmission. The observation that AMPARs are highly concentrated in nanodomains, instead of diffusively distributed in the PSD as generally thought, has important consequences on our understanding of excitatory neurotransmission. Furthermore, our results indicate that glutamatergic synaptic transmission is controlled by the nanometer-scale regulation of the size of these highly concentrated nanodomains.
Figures
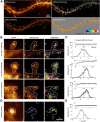
Figure 1.
High-density and super-resolution light imaging of AMPAR localization reveals organization in nanodomains. A, Comparison between epifluorescence, super-resolution intensity image, trajectories, and diffusion map of a neuron expressing Eos::GluA1. The epifluorescence image is obtained from the native nonphotoconverted green form of Eos molecule. The super-resolution intensity image is obtained by sptPALM from a sequence of 20,000 images of sparse single molecules in the photoconverted Eos red channel. The images of trajectories represent the individual trajectories longer than 8 frames (20 ms per frame) of activated single Eos molecules. The diffusion map corresponds to the average instantaneous diffusion coefficients computed from the MSD of each trajectory. B, D, Examples of AMPAR organization inside spines of live hippocampal neurons by sptPALM (B) and uPAINT (D). Synapses are labeled with the expression of either Homer1c::Cerulean for sptPALM experiments or Homer1c::GFP for uPAINT. From left to right, Epifluorescence images of expressed Homer1c, the corresponding super-resolution sptPALM intensity images and trajectories obtained from cells transfected with Eos::GluA1, Eos::GluA2, Eos::GluA2 plus untagged GluA1, or uPAINT of endogenously expressed GluA2 containing AMPAR (Surf-GluA2). C, E, Average distribution of instantaneous diffusion coefficients and MSD curves (insets) for sptPALM (C) and uPAINT (E) of synaptic AMPAR. Error bars indicate cell-to-cell variability. For sptPALM experiments, the peak of the MSD distribution for Eos::GluA1 is left shifted compared with that of Eos::GluA2, indicating a larger fraction of slowly mobile versus highly mobile Eos::GluA2-containing receptors (threshold indicated by the vertical dashed line). Coexpression of untagged GluA1 with Eos::GluA2 partially restores AMPAR organization into nanodomains and the immobilization of Eos::GluA2-containing receptors. For uPAINT experiments, the MSD histogram for Surf-GluA2 is shifted toward the immobile fraction but indicates a bimodal distribution similar to overexpressed Eos::GluA1. Eos::GluA1 monitored by sptPALM and Surf-GluA2 receptors recorded with uPAINT present a high confinement inside synapses compared with Eos::GluA2 monitored by sptPALM. The confinement area obtained with the MSD plateau (horizontal dashed line) is 4–5 times larger for Eos::GluA2 than Eos::GluA1 and Surf-GluA2. This indicates that Eos::GluA2 AMPAR explore more surface area than Eos::GluA1or endogenous Surf-GluA2 AMPAR in spines.
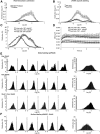
Figure 2.
Comparative characteristics of endogenous and overexpressed AMPAR diffusion in live and fixed neurons. A, Specificity of sptPALM localization. Contribution of the intracellular staining to the signal detected in sptPALM images was analyzed by comparing the histograms of instantaneous diffusion coefficients on cells where extracellular Eos coupled to GluA1 was cleaved by the TEV protease (protease) to that of control cells incubated with protease inactivated by boiling (boiled protease). B, Specificity of the antibodies binding in uPAINT. Comparison of the intensity of GluA2 endogenous labeling with uPAINT technique on wild-type neurons (wild-type) and neurons from GluA2 knock-out mice. These experiments reveal a nonspecific labeling of ∼15%. Instantaneous diffusion histograms are normalized to trajectories/μm2. C, Comparison of AMPAR mobility in live and fixed cells with different antibodies. Two different antibodies yield comparable mobility histograms in live cells. Performing uPAINT on fixed cells results in a histogram shifted toward immobile fractions. D, Different antibodies against GluA2 used for uPAINT provide comparable confinement kinetics. The confinement value of fixed molecules is twofold smaller than the confined fraction of mobile AMPAR in the synapse, indicating that the accuracy of localization does not limit the measurement of nanodomain confinement properties in live neurons. E, F, Diffusion coefficient histograms of various AMPAR subunits in multiple cells using sptPALM (E) and uPAINT (F). Illustration of the variability of instantaneous diffusion coefficient histograms from whole dendritic segments of neurons transfected with Eos::GluA1, Eos::GluA2, Eos::GluA2 + untagged GluA1, and endogenous surface AMPAR. For each construct, the distribution of six different cells is provided together with the mean distribution computed from all cells (rightmost histograms). Eos::GluA2 mobility distribution presents a narrow distribution enriched in highly mobile fraction, whereas Eos::GluA1 shows a broad bimodal distribution with a fast and slow or immobile fraction. Surface AMPA receptors labeled by antibody against GluA2 exhibit a broad distribution similar to that of Eos::GluA1.
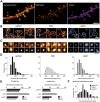
Figure 3.
Quantification of AMPAR nanodomain size and density by multiple super-resolution light imaging techniques. A, Confocal and STED images of a dendritic segment expressing Homer1c::GFP (left, confocal) that was live-stained for Surf-GluA2-ATTO647N for STED imaging (middle, STED). Overlaid images (right; Homer1c::GFP shown in magenta; STED GluA2 shown in green). B, Gallery of super-resolution images of spines imaged by sptPALM (Eos::GluA1), STED, and uPAINT (Surf-GluA2-ATTO647N). C, Examples of AMPAR nanodomains imaged by sptPALM, STED, and uPAINT, and the corresponding fit using 2D anisotropic Gaussian functions. D, Distributions of the principal (length) axis of nanodomains obtained by 2D anisotropic Gaussian fitting. sptPALM, STED, and uPAINT display similar distributions centered at 80, 120, and 70 nm, respectively. E, Comparison of the mean lengths (principal) and widths (auxiliary) of nanodomains in living and fixed cells for the different techniques. F, Quantification of the number of nanodomains per spine with the different imaging techniques shows that ∼50% of spines contain one or two nanodomains.
Figure 4.
Nanodomain size and per-spine abundance revealed by pre-embedding immunogold EM. A, Low-magnification view of a portion of dendrite containing three synaptic spines that was live-labeled for GluA2 before fixation and then labeled with secondary fab′ fragment conjugated to a 1.4 nm gold particle. Silver-intensified label particles are highly concentrated at PSD-membrane in spines (7.23 particles/μm). Label particles are also present on extrasynaptic spine membrane (2.12 particles/μm) and at a relatively low density on the dendritic plasma membrane (1.24 particles/μm). B, High-magnification views of individual spine synapses show that label particles are present in nanodomains (solid arrows) or as single-label particles (dashed arrows). C, Histogram of the clusters of immunogold particles size in 2D EM sections showing that the average length of clusters of two or more label particles fits a single Gaussian with a mean of 77.48 ± 23.98. D, Images of three spines that were serial sectioned and used for 3D reconstructions (right) and count the number of nanodomains per spine. The number in lower right corner of each EM image indicates the number of nanodomains counted on each spine.
Figure 5.
Dynamics of AMPAR nanodomain composition, shape, and position. A, Illustration of the diffusive behavior of Surf-GluA2-ATTO647N-labeled endogenous AMPAR inside and outside nanodomains observed by uPAINT. Measurement of the dynamics of AMPAR localization illustrates three different types of behavior within and in between nanodomains. The times spent by individual AMPAR inside and outside nanodomains are represented in red and blue, respectively. In Type 1, AMPAR randomly diffuse in the vicinity of nanodomains without getting trapped. In Type 2, AMPAR alternate between inside and outside the nanodomains before getting strongly trapped in the nanodomain and confined. In Type 3, AMPAR are immobilized for the duration of the recording in the nanodomain. Examples of trajectories for the three types of behaviors are displayed, with red circles indicating the nanodomains. MSD curves of Type 1 (blue) and Type 3 (red) illustrate a strong confinement of Type 3 molecules compared with Type 1. B, Graph of the instantaneous diffusion coefficient versus time that reveal a slow AMPAR diffusion inside nanodomains and a much faster one in synapse but outside of nanodomains. C, Duration of synaptic single-molecule trajectories inside and outside nanodomains. Synaptic trajectories outside nanodomain display a residency time of <500 ms for >90% of the observed trajectories. For intrananodomain molecules, the residency time is longer than 5 s for at least 50% of the trajectories, confirming the AMPAR retention inside nanodomains. D, Nanodomain stability histogram measured using time-lapse sptPALM shows that >20% of the nanodomains remain stable during the entire experiment duration (almost 1 h).
Figure 6.
Time-lapse sptPALM recordings reveal stability of nanodomains. A, Examples of time-lapse sptPALM on three different synapses and the corresponding kymographs showing the presence of single molecules inside one nanodomain over time. Left side column, Epifluorescence images of the synapses labeled by Homer1c::Cerulean. Pseudo-color galleries represent the Eos::GluA1 super-resolution sptPALM intensity images acquired during 50 s every 5 min. It shows that some nanodomains remain stable for the time of observation (first row), whereas the second and third rows display a more dynamic behavior of nanodomains or spine, including appearance and disappearance events. The kymograph displays the detection of fluorescent single molecules over time inside a nanodomain identified by the red star. Several possible patterns of single molecule fluctuations are visible along the time course, confirming that each nanodomain is a result of immobilization of several Eos-tagged GluA1 subunits. B, Kymograph of multiple nanodomains on a single spine extracted from a sptPALM experiment. Left side image, Super-resolution sptPALM intensity image of Eos::GluA1. The second column represents the super-resolution sptPALM intensity image sequence of the corresponding spine head every 80 s. The arrows point to different nanodomains. Right column, Kymographs computed for each nanodomain represented by their respective color. The patterns of fluctuations denote that, whereas some domains are highly stable over time, other domains appear and disappear in the time range of minutes. C, Left panel, sptPALM intensity image of a spine expressing EOS::GluA1. Nanodomains are identified by a dashed circle. Right panel, Projection of a subset of single-molecule trajectories observed in the corresponding spine. Red represents strongly confined trajectories; blue and green represent diffusive and weakly confined trajectories, respectively. D, Cumulative distribution of instantaneous diffusion coefficients of the trajectories observed exclusively inside nanodomains (In), exclusively outside nanodomains (Out), or exchanging between inside and outside nanodomains (In/Out). E, Average mean square diffusion plots for single-molecule trajectories observed exclusively inside nanodomains (In), exclusively outside nanodomains (Out), or exchanging between inside and outside nanodomains (In/Out).
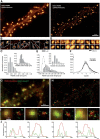
Figure 7.
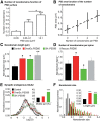
Subdiffraction quantification of PSD95 organization in spines and comparison with endogenous AMPARs. A, Comparison between epifluorescence and super-resolution intensity image of a neuron expressing Eos::PSD95. B, Gallery of super-resolution images of spines imaged by sptPALM (Eos::PSD95). C, Distribution of the area of the clusters of PSD95 from the spine with inset representing the distribution of the cluster lengths. D, Examples of PSD95 subclusters acquired by sptPALM and the corresponding fit performed using 2D anisotropic Gaussian functions. E, The principal axis (length) of PSD95 subclusters obtained by 2D anisotropic Gaussian fitting. The continuous line represents the corresponding distribution of GluA1 subunit nanodomains obtained by sptPALM. Inset, Distribution of PSD95 subclusters per cluster obtained by sptPALM. F, Distributions of the synaptic (white) versus the dendritic mobility (black) of PSD95 obtained by sptPALM. G, H, Comparison of colocalization between endogenous PSD95 (red) and endogenous surface GluA1 (green) between an epifluorescence image (G) and the corresponding dSTORM super-resolution image (H). I, Gallery of comparison of individual synapses for colocalization between endogenous PSD95 (red) and endogenous surface GluA1 (green). For better visibility, GluA1 super-resolution images are depicted with a γ of 2. J, Line-scans on the corresponding super-resolution images in the above gallery illustrating that PSD95 (red) is not uniformly distributed within the synapse but organized in subclusters, indicating heterogeneity in the distribution of endogenous PSD95 within PSD. In contrast to PSD95, GluA1 (green) shows a nanodomain distribution with a higher contrast between intensities in the nanodomain versus extra nanodomain regions. It can also be observed in the line-scan that in many cases nanodomains of GluA1 overlap with subclusters of the PSD95, whereas domains with no overlap are also visible.
Figure 8.
Correlation of PSD size with AMPAR nanodomains and effects of the modulation of endogenous PSD95 on nanodomain characteristics. A, Plot of the number of nanodomains per PSD for various ranges of sizes of the PSD measured from the PSD95 staining using dual-color dSTORM. Significant differences were observed between each dataset (p < 0.05). B, Plot of the number of nanodomains as a function of the PSD area. Interestingly, the data nicely fit with a linear model (dashed line). These data indicate that the PSD area is directly proportional to the number of nanodomains. C, Comparison of nanodomain length between control and modulation of endogenous PSD95 levels. Black, red, green, and gray represent control, OverEx::PSD95, SH::PSD95, and Rescue::PSD95, respectively. D, Variability of the number of nanodomains per spine for different experimental conditions. E, Distributions of synaptic diffusion coefficients of endogenous AMPAR measured by uPAINT, for different experimental conditions. Neurons were transfected with Homer-DsRed as a synaptic marker. Inset, Mobile fraction of receptors for each condition. F, Distributions of nanodomain lengths measured by uPAINT on live neurons with different levels of PSD95 expression. Average values of nanodomain lengths are plotted in the inset. *p < 0.05. **p < 0.01. ***p < 0.001.
Figure 9.
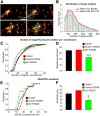
Estimation of number of AMPAR per nanodomain and correlation with mEPSC. A, Localization of AMPAR single emitters and nanodomains and estimate of their AMPAR content. Left column shows two spines labeled with surface endogenous GluA2 reconstructed from dSTORM. Right column displays the estimate of AMPAR content for some single isolated emitters (red) and nanodomains (green), together with distances between nanodomain (in nm, blue). In these examples, nanodomain content varies between 7.3 and 42.2 AMPARs and the distances between nanodomains range from 260 to 710 nm. B, Intensity distribution of single fluorescent emitters outside nanodomains, in the dendritic shaft. The distribution fits with a sum of two Gaussian distributions, the second one being centered on twice the center of the first one. C, Histograms of AMPAR content estimate inside nanodomains for control (black) and SH::PSD95 (green) conditions. The estimated number of molecules per nanodomain is reduced in the case of SH::PSD95 compared with the control condition. D, Variation of AMPAR density in nanodomains for various levels of endogenous PSD95 expression. ***p < 0.001. E, mEPSC distribution obtained by patch-clamp recordings on neurons expressing the same constructs as in Figure 8_C_, D. F, Average values of the mEPSCs are plotted for various modulations of endogenous PSD95 levels. *p < 0.05.
Figure 10.
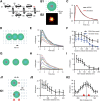
Modeling the role of AMPAR nanodomain in synaptic transmission. A, Kinetic AMPAR state diagram used for the Monte Carlo simulations performed essentially as described previously (Heine et al., 2008) and in Materials and Methods. AMPAR kinetics were modeled using Monte Carlo simulation (Glavinovic and Rabie, 1998; Franks et al., 2002; Raghavachari and Lisman, 2004; Heine et al., 2008) using a 7 state model and published values for kinetics rate constants, adjusted to fit the experimentally recorded mEPSCs in our system. In this scheme, resting AMPARs are in a C1 state and move to states C2 and C3 upon successive binding of two glutamate molecules. O4 is the open state, whereas D5, D6, and D7 are desensitized states. Mono-liganded D7 desensitized AMPARs can move to the biliganded D6 state. B1, Schematic drawing of clustered AMPAR arrangement with respect to glutamate release. A cluster of 25 (5 × 5) AMPAR (red dots) is positioned in front the glutamate release site, spaced by 20 nm in basal conditions. Extracluster receptors are disposed regularly spaced at 100 nm intervals (blue dots), and 3000 glutamate (green halo) molecules are released on top of the cluster at time 0 in the presynaptic cell lying 15 nm away from the postsynapse. Glutamate was allowed to diffuse at 0.1 μm2 · ms−1 as noted previously (Nielsen et al., 2004; Budisantoso et al., 2012) in the synaptic cleft (15 nm wide). B2, Color-coded plot of the cumulative probability of AMPAR opening within 10 ms after release of a vesicle containing 3000 glutamate molecules (arbitrary units) obtained by averaging 32 sweeps. The diameter of the activated area has a FWHM ∼160 nm. C, Comparison of experimentally recorded spontaneous mEPSCs (average of 1700 individual events from 17 cells) and simulated EPSCs (average of 32 sweeps) obtained in conditions as in B1. Both curves are normalized for comparison. See below and Figure 9 for the respective amplitudes in various conditions of simulations or recording. D–F, Variation of mEPSC amplitude as the site of glutamate release is moved away from the nanocluster localization, as schematized in D. Receptors are distributed as in B1. Sample mEPSCs (averages of 16 runs) are represented in E, and the mean number of open AMPAR ± SD in individual runs is presented in F in the presence (black circles) or absence (blue squares) of receptors outside the nanoclusters (i.e., with or without the blue dots in the D scheme). G–I, Dependence of mEPSCs on the AMPAR packing density, as schematized in G. Series of simulated AMPAR-mediated mEPSCs (average of 16 trials) as a function of receptor packing interval (in nanometers) are represented in H, and the mean number of open AMPAR ± SD in individual runs is presented in I. J1, J2, Variation of mEPSCs amplitude when two equivalent nanoclusters are present in the synapse at varying distance. Glutamate (3000 molecules) is released on top of the first cluster (5×5 receptors), whereas a second cluster of identical size is positioned at varying distances, as schematized in J1. The mean number of open AMPAR ± SD in individual runs as the function of the intercluster distance is presented in J2. K1, K2, Variation of mEPSCs amplitude when two equivalent nanoclusters are present in the synapse at a fixed distance of 300 nm one form the other, whereas 3000 glutamate molecules are released at varying locations, as schematized in K1. The mean number of open AMPAR ± SD in individual runs as a function of the position of the release site with respect to the two clusters is presented in K2. Two red triangles represent the location of the clusters.
Comment in
- Contribution of postsynaptic molecules to AMPA receptor nanodomain organization.
Barrera-Ocampo A, Chater TE. Barrera-Ocampo A, et al. J Neurosci. 2013 Dec 4;33(49):19048-50. doi: 10.1523/JNEUROSCI.4273-13.2013. J Neurosci. 2013. PMID: 24305802 Free PMC article. No abstract available.
Similar articles
- The interaction between Stargazin and PSD-95 regulates AMPA receptor surface trafficking.
Bats C, Groc L, Choquet D. Bats C, et al. Neuron. 2007 Mar 1;53(5):719-34. doi: 10.1016/j.neuron.2007.01.030. Neuron. 2007. PMID: 17329211 - Differential requirement for NMDAR activity in SAP97β-mediated regulation of the number and strength of glutamatergic AMPAR-containing synapses.
Liu M, Lewis LD, Shi R, Brown EN, Xu W. Liu M, et al. J Neurophysiol. 2014 Feb;111(3):648-58. doi: 10.1152/jn.00262.2013. Epub 2013 Nov 13. J Neurophysiol. 2014. PMID: 24225540 Free PMC article. - Endocytic trafficking and recycling maintain a pool of mobile surface AMPA receptors required for synaptic potentiation.
Petrini EM, Lu J, Cognet L, Lounis B, Ehlers MD, Choquet D. Petrini EM, et al. Neuron. 2009 Jul 16;63(1):92-105. doi: 10.1016/j.neuron.2009.05.025. Neuron. 2009. PMID: 19607795 Free PMC article. - The GLUR2 subunit of AMPA receptors: synaptic role.
Bassani S, Valnegri P, Beretta F, Passafaro M. Bassani S, et al. Neuroscience. 2009 Jan 12;158(1):55-61. doi: 10.1016/j.neuroscience.2008.10.007. Epub 2008 Oct 10. Neuroscience. 2009. PMID: 18977416 Review. - Promiscuous interactions between AMPA-Rs and MAGUKs.
Fitzjohn SM, Doherty AJ, Collingridge GL. Fitzjohn SM, et al. Neuron. 2006 Oct 19;52(2):222-4. doi: 10.1016/j.neuron.2006.10.002. Neuron. 2006. PMID: 17046684 Review.
Cited by
- Relative Contributions of Specific Activity Histories and Spontaneous Processes to Size Remodeling of Glutamatergic Synapses.
Dvorkin R, Ziv NE. Dvorkin R, et al. PLoS Biol. 2016 Oct 24;14(10):e1002572. doi: 10.1371/journal.pbio.1002572. eCollection 2016 Oct. PLoS Biol. 2016. PMID: 27776122 Free PMC article. - Quantifying molecular aggregation by super resolution microscopy within an excitatory synapse from mouse hippocampal neurons.
Kedia S, Ramanan N, Nair D. Kedia S, et al. STAR Protoc. 2021 Apr 14;2(2):100470. doi: 10.1016/j.xpro.2021.100470. eCollection 2021 Jun 18. STAR Protoc. 2021. PMID: 33937876 Free PMC article. - A binding site outside the canonical PDZ domain determines the specific interaction between Shank and SAPAP and their function.
Zeng M, Shang Y, Guo T, He Q, Yung WH, Liu K, Zhang M. Zeng M, et al. Proc Natl Acad Sci U S A. 2016 May 31;113(22):E3081-90. doi: 10.1073/pnas.1523265113. Epub 2016 May 16. Proc Natl Acad Sci U S A. 2016. PMID: 27185935 Free PMC article. - Control of Transmembrane Protein Diffusion within the Postsynaptic Density Assessed by Simultaneous Single-Molecule Tracking and Localization Microscopy.
Li TP, Blanpied TA. Li TP, et al. Front Synaptic Neurosci. 2016 Jul 22;8:19. doi: 10.3389/fnsyn.2016.00019. eCollection 2016. Front Synaptic Neurosci. 2016. PMID: 27499742 Free PMC article. - Immunoglobulin-Like Receptors and Their Impact on Wiring of Brain Synapses.
Cameron S, McAllister AK. Cameron S, et al. Annu Rev Genet. 2018 Nov 23;52:567-590. doi: 10.1146/annurev-genet-120417-031513. Epub 2018 Sep 13. Annu Rev Genet. 2018. PMID: 30212237 Free PMC article. Review.
References
Publication types
MeSH terms
Substances
LinkOut - more resources
Full Text Sources
Other Literature Sources
Molecular Biology Databases
