Global proteomics and pathway analysis of pressure-overload-induced heart failure and its attenuation by mitochondrial-targeted peptides - PubMed (original) (raw)
. 2013 Sep 1;6(5):1067-76.
doi: 10.1161/CIRCHEARTFAILURE.113.000406. Epub 2013 Aug 9.
Edward J Hsieh, Tony Chen, Lorena G Menendez, Nathan B Basisty, Lauren Tsai, Richard P Beyer, David A Crispin, Nicholas J Shulman, Hazel H Szeto, Rong Tian, Michael J MacCoss, Peter S Rabinovitch
Affiliations
- PMID: 23935006
- PMCID: PMC3856238
- DOI: 10.1161/CIRCHEARTFAILURE.113.000406
Global proteomics and pathway analysis of pressure-overload-induced heart failure and its attenuation by mitochondrial-targeted peptides
Dao-Fu Dai et al. Circ Heart Fail. 2013.
Abstract
Background: We investigated the protective effects of mitochondrial-targeted antioxidant and protective peptides, Szeto-Schiller (SS) 31 and SS20, on cardiac function, proteomic remodeling, and signaling pathways.
Methods and results: We applied an improved label-free shotgun proteomics approach to evaluate the global proteomics changes in transverse aortic constriction (TAC)-induced heart failure and the associated signaling pathway changes using ingenuity pathway analysis. We found that 538 proteins significantly changed after TAC, which mapped to 53 pathways. The top pathways were in the categories of actin cytoskeleton, mitochondrial function, intermediate metabolism, glycolysis/gluconeogenesis, and citrate cycle. Concomitant treatment with SS31 ameliorated the congestive heart failure phenotypes and mitochondrial damage induced by TAC, in parallel with global attenuation of mitochondrial proteome changes, with an average of 84% protection of mitochondrial and 69% of nonmitochondrial protein changes. This included significant amelioration of all the ingenuity pathway analysis noted above. SS20 had only modest effects on heart failure and this tracked with only partial attenuation of global proteomics changes; furthermore, actin cytoskeleton pathways were significantly protected in SS20, whereas mitochondrial and metabolic pathways essentially were not.
Conclusions: This study elucidates the signaling pathways significantly changed in pressure-overload-induced heart failure. The global attenuation of TAC-induced proteomic alterations by the mitochondrial-targeted peptide SS31 suggests that perturbed mitochondrial function may be an upstream signal to many of the pathway alterations in TAC and supports the potential clinical application of mitochondrial-targeted peptide drugs for the treatment heart failure.
Keywords: heart failure; mitochondria; proteomics; signal transduction.
Figures
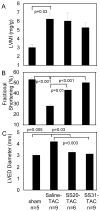
Figure 1. Echocardiography measurement after 4 weeks of TAC
(A) Left ventricular mass index (LVMI). (B) Fractional shortening significantly declined in saline-TAC; this was significantly ameliorated by SS20 and more so by SS31, but not by SS48. (C) Interventricular septum (IVS), left ventricular posterior wall (LVPW) thickness and left ventricular end-diastolic dimension (LVEDD). *p<0.05 compared with sham.
Figure 2. Pathology of TAC-induced heart failure
(A) Representative images of sham, saline-TAC and SS31-TAC treated hearts. (B) Heart weight and lung weight normalized to tibia length (mg/mm). (C) Representative Masson trichrome stain of the heart displayed marked interstitial fibrosis (blue) in saline-TAC hearts. (D) Quantitative analysis of fibrosis (% myocardial area) revealed that fibrosis in saline-TAC was significantly attenuated by SS31, but not by SS20 or SS48. (E) Quantitative PCR of collagen1a2 normalized to 18s. *p<0.05 for sham vs. saline-TAC, #p<0.05 TAC-SS vs. saline-TAC.
Figure 3. Mitochondrial damage in TAC-induced heart failure
(A) Mitochondrial protein carbonyl content (nmol/mg) measured by enzyme immunoassay. (B) Western blots of microtubule associated protein light chain 3 (LC3) demonstrated significant increase in LC3-II, a marker of activated autophagosomes, in saline-TAC hearts, which was significantly attenuated in SS31-TAC and partially attenuated in SS20-TAC hearts. Representative electron micrograph of cardiac apices in sham (C), saline-TAC (D) and SS31-TAC (E) demonstrated increased numbers of damaged mitochondria and autophagosomes (arrows) in saline-TAC hearts. (F) Higher magnification of mitochondria showed disrupted cristae in saline-TAC hearts (left) compared to normal cristae in SS31-TAC hearts (right panel). (G) Quantitative analysis of the number of autophagosomes (per 100μm2) and mitochondrial cristae density (cristae/μm). *p<0.05 for sham vs. saline-TAC, #p<0.05 SS31-TAC vs. saline-TAC.
Figure 4. Scatter plots of protein changes by proteomics analysis
The fold change (log2) in 538 significantly altered proteins in sham vs. saline-TAC hearts is shown on the x-axis (A–C). The y axis shows the corresponding change of each protein in each TAC-SS-peptide vs. saline-TAC comparison: SS31 (A) or SS20 (B). Proteins are shown as mitochondrial (red) or non-mitochondrial (blue) in panels A–D. (C) shows the fold changes in 277 proteins significantly altered only in SS31-TAC vs. saline-TAC that are not significant in the sham vs. saline-TAC comparison.
Figure 5. Heat map of abundance ratio of the top canonical pathways from Ingenuity Pathway Analysis
The abundance ratio of each component proteins of a pathway is colored red when higher in the SS-20, sham or SS-31treatment (numerator) than in the saline-TAC (denominator) in the ratio comparison. The color is blue for the converse. The top 15 canonical pathways are ordered from most significant (top of left set) to least (bottom of right set) Any protein that was significant in any one or more of the three ratio comparisons is included in the heat map. The intensity of color indicates the magnitude of change, with the scale shown at the bottom.
Figure 6. Network of mitochondrial oxidative phosphorylation (A, B) and citrate cycle (C, D), derived from Ingenuity Pathway Analysis
Symbols are colored red when significantly down regulated and green when significantly up-regulated; the intensity of color indicates the magnitude of change, with the scale shown in Figure 4A. (A) and (C) Sham vs. saline-TAC, (B) and (D) SS31-TAC vs. saline-TAC. Red in A and C indicates downregulation in TAC; red in B and D indicates SS31 attenuation of downregulation in TAC.
Similar articles
- Induction of heart failure by minimally invasive aortic constriction in mice: reduced peroxisome proliferator-activated receptor γ coactivator levels and mitochondrial dysfunction.
Faerber G, Barreto-Perreia F, Schoepe M, Gilsbach R, Schrepper A, Schwarzer M, Mohr FW, Hein L, Doenst T. Faerber G, et al. J Thorac Cardiovasc Surg. 2011 Feb;141(2):492-500, 500.e1. doi: 10.1016/j.jtcvs.2010.03.029. Epub 2010 May 5. J Thorac Cardiovasc Surg. 2011. PMID: 20447656 - Diabetic db/db mice do not develop heart failure upon pressure overload: a longitudinal in vivo PET, MRI, and MRS study on cardiac metabolic, structural, and functional adaptations.
Abdurrachim D, Nabben M, Hoerr V, Kuhlmann MT, Bovenkamp P, Ciapaite J, Geraets IME, Coumans W, Luiken JJFP, Glatz JFC, Schäfers M, Nicolay K, Faber C, Hermann S, Prompers JJ. Abdurrachim D, et al. Cardiovasc Res. 2017 Aug 1;113(10):1148-1160. doi: 10.1093/cvr/cvx100. Cardiovasc Res. 2017. PMID: 28549111 - A novel mtDNA repair fusion protein attenuates maladaptive remodeling and preserves cardiac function in heart failure.
Bradley JM, Li Z, Organ CL, Polhemus DJ, Otsuka H, Islam KN, Bhushan S, Gorodnya OM, Ruchko MV, Gillespie MN, Wilson GL, Lefer DJ. Bradley JM, et al. Am J Physiol Heart Circ Physiol. 2018 Feb 1;314(2):H311-H321. doi: 10.1152/ajpheart.00515.2017. Epub 2017 Nov 3. Am J Physiol Heart Circ Physiol. 2018. PMID: 29101177 Free PMC article. - Disruption of actin dynamics regulated by Rho effector mDia1 attenuates pressure overload-induced cardiac hypertrophic responses and exacerbates dysfunction.
Abe I, Terabayashi T, Hanada K, Kondo H, Teshima Y, Ishii Y, Miyoshi M, Kira S, Saito S, Tsuchimochi H, Shirai M, Yufu K, Arakane M, Daa T, Thumkeo D, Narumiya S, Takahashi N, Ishizaki T. Abe I, et al. Cardiovasc Res. 2021 Mar 21;117(4):1103-1117. doi: 10.1093/cvr/cvaa206. Cardiovasc Res. 2021. PMID: 32647865 - Divide and conquer: the application of organelle proteomics to heart failure.
Agnetti G, Husberg C, Van Eyk JE. Agnetti G, et al. Circ Res. 2011 Feb 18;108(4):512-26. doi: 10.1161/CIRCRESAHA.110.226910. Circ Res. 2011. PMID: 21335433 Free PMC article. Review.
Cited by
- The mitochondrial-targeted peptide, SS-31, improves glomerular architecture in mice of advanced age.
Sweetwyne MT, Pippin JW, Eng DG, Hudkins KL, Chiao YA, Campbell MD, Marcinek DJ, Alpers CE, Szeto HH, Rabinovitch PS, Shankland SJ. Sweetwyne MT, et al. Kidney Int. 2017 May;91(5):1126-1145. doi: 10.1016/j.kint.2016.10.036. Epub 2017 Jan 4. Kidney Int. 2017. PMID: 28063595 Free PMC article. - Chronic Therapy With Elamipretide (MTP-131), a Novel Mitochondria-Targeting Peptide, Improves Left Ventricular and Mitochondrial Function in Dogs With Advanced Heart Failure.
Sabbah HN, Gupta RC, Kohli S, Wang M, Hachem S, Zhang K. Sabbah HN, et al. Circ Heart Fail. 2016 Feb;9(2):e002206. doi: 10.1161/CIRCHEARTFAILURE.115.002206. Circ Heart Fail. 2016. PMID: 26839394 Free PMC article. - Therapeutic Approaches to Treat Mitochondrial Diseases: "One-Size-Fits-All" and "Precision Medicine" Strategies.
Bottani E, Lamperti C, Prigione A, Tiranti V, Persico N, Brunetti D. Bottani E, et al. Pharmaceutics. 2020 Nov 11;12(11):1083. doi: 10.3390/pharmaceutics12111083. Pharmaceutics. 2020. PMID: 33187380 Free PMC article. Review. - Quantitative Non-canonical Amino Acid Tagging (QuaNCAT) Proteomics Identifies Distinct Patterns of Protein Synthesis Rapidly Induced by Hypertrophic Agents in Cardiomyocytes, Revealing New Aspects of Metabolic Remodeling.
Liu R, Kenney JW, Manousopoulou A, Johnston HE, Kamei M, Woelk CH, Xie J, Schwarzer M, Garbis SD, Proud CG. Liu R, et al. Mol Cell Proteomics. 2016 Oct;15(10):3170-3189. doi: 10.1074/mcp.M115.054312. Epub 2016 Aug 9. Mol Cell Proteomics. 2016. PMID: 27512079 Free PMC article. - Treatment of age-related visual impairment with a peptide acting on mitochondria.
Alam NM, Douglas RM, Prusky GT. Alam NM, et al. Dis Model Mech. 2022 Mar 1;15(3):dmm048256. doi: 10.1242/dmm.048256. Epub 2022 Feb 21. Dis Model Mech. 2022. PMID: 34766182 Free PMC article.
References
- Levy D, Larson MG, Vasan RS, Kannel WB, Ho KK. The progression from hypertension to congestive heart failure. JAMA. 1996;275:1557–1562. - PubMed
- Heineke J, Molkentin JD. Regulation of cardiac hypertrophy by intracellular signalling pathways. Nat Rev Mol Cell Biol. 2006;7:589–600. - PubMed
- Lindsey ML, Goshorn DK, Comte-Walters S, Hendrick JW, Hapke E, Zile MR, Schey K. A multidimensional proteomic approach to identify hypertrophy-associated proteins. Proteomics. 2006;6:2225–2235. - PubMed
- Kocher T, Pichler P, Schutzbier M, Stingl C, Kaul A, Teucher N, Hasenfuss G, Penninger JM, Mechtler K. High precision quantitative proteomics using iTRAQ on an LTQ Orbitrap: a new mass spectrometric method combining the benefits of all. J Proteome Res. 2009;8:4743–4752. - PubMed
Publication types
MeSH terms
Substances
Grants and funding
- Z01 AG000751/ImNIH/Intramural NIH HHS/United States
- R01 HL101186/HL/NHLBI NIH HHS/United States
- P01 AG001751/AG/NIA NIH HHS/United States
- R01 HL110349/HL/NHLBI NIH HHS/United States
- T32 AG000057/AG/NIA NIH HHS/United States
- HL101186/HL/NHLBI NIH HHS/United States
- P30 AG013280/AG/NIA NIH HHS/United States
- AG013280/AG/NIA NIH HHS/United States
LinkOut - more resources
Full Text Sources
Other Literature Sources
Medical


