Embryonic stem cell self-renewal pathways converge on the transcription factor Tfcp2l1 - PubMed (original) (raw)
Embryonic stem cell self-renewal pathways converge on the transcription factor Tfcp2l1
Shoudong Ye et al. EMBO J. 2013.
Abstract
Mouse embryonic stem cell (mESC) self-renewal can be maintained by activation of the leukaemia inhibitory factor (LIF)/signal transducer and activator of transcription 3 (Stat3) signalling pathway or dual inhibition (2i) of glycogen synthase kinase 3 (Gsk3) and mitogen-activated protein kinase kinase (MEK). Several downstream targets of the pathways involved have been identified that when individually overexpressed can partially support self-renewal. However, none of these targets is shared among the involved pathways. Here, we show that the CP2 family transcription factor Tfcp2l1 is a common target in LIF/Stat3- and 2i-mediated self-renewal, and forced expression of Tfcp2l1 can recapitulate the self-renewal-promoting effect of LIF or either of the 2i components. In addition, Tfcp2l1 can reprogram post-implantation epiblast stem cells to naïve pluripotent ESCs. Tfcp2l1 upregulates Nanog expression and promotes self-renewal in a Nanog-dependent manner. We conclude that Tfcp2l1 is at the intersection of LIF- and 2i-mediated self-renewal pathways and plays a critical role in maintaining ESC identity. Our study provides an expanded understanding of the current model of ground-state pluripotency.
Conflict of interest statement
The authors declare that they have no conflict of interest.
Figures
Figure 1
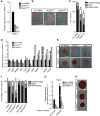
2i induces multiple transcription factors to promote mESC self-renewal. (A) Scatter plots of DNA microarray data showing Tfcp2l1, Klf2, Klf4, Nanog, and Tbx3 gene signal intensities for C57BL/6 mESCs cultured in serum/LIF/2i or serum/LIF for 12 h. (B) qRT–PCR analysis of Tbx3, Klf2, Klf4, Tfcp2l1, and Nanog expression in C57BL/6 mESCs cultured in the presence of serum/LIF/2i or serum/LIF for 12 h. Error bars are the s.d. of three biological replicates. (C) Western blot analysis of indicated Flag-tagged proteins in C57BL/6 mESCs cultured in LIF/2i. α-Tubulin is a loading control. (D) Alkaline phosphatase staining of colonies arising from transfectants cultured in serum/LIF for two passages. Scale bar, 100 μm. (E) Quantification of alkaline phosphatase-positive colonies. Data represent mean±s.d. from triplicate experiments. Source data for this figure is available on the online supplementary information page.
Figure 2
Enforced Tfcp2l1 phenocopies PD03 or CHIR to promote ground-state pluripotency. (A) qRT–PCR analysis of Tfcp2l1 expression in 46C mESCs treated for 12 h with LIF, CHIR, and/or PD03 as indicated. Data represent mean±s.d. of three biological replicates. (B) Western blot analysis of GFP and Tfcp2l1 expression in i-EGFP and i-Tfcp2l1 mESCs cultured in the presence or absence of 0.2 μg/ml Dox for 12 h. (C) i-EGFP and i-Tfcp2l1 mESCs were cultured in N2B27/CHIR for five passages in the presence or absence of Dox. Scale bar, 100 μm. (D, E) Alkaline phosphatase staining of i-Tfcp2l1 mESCs cultured in the presence or absence of Dox and quantification of alkaline phosphatase-positive colonies. Scale bar, 100 μm. Data represent mean±s.d. from triplicate experiments. (F) qRT–PCR analysis of Klf4, Nanog, Cdx2, Fgf5, T, Mixl1, Gata4, and Gata6 expression in i-Tfcp2l1 mESCs cultured in N2B27/CHIR with or without Dox. Data represent mean±s.d. of three biological replicates. (G) Immunostaining for neural marker Nestin, cardiomyocyte marker Myosin, and primitive endoderm marker Gata4 in i-Tfcp2l1 mESC-derived differentiated cells. Hoechst was used for nuclear staining. Scale bar, 100 μm. (H, I) Morphology, alkaline phosphatase staining, and immunostaining of i-Tfcp2l1 mESCs cultured in N2B27/PD03 with or without Dox for five passages. Scale bars, 100 μm. Source data for this figure is available on the online supplementary information page.
Figure 3
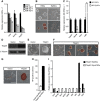
Enforced Tfcp2l1 promotes mESC self-renewal independent of LIF/Stat3. (A) qRT–PCR analysis of Socs3, Klf4, and Tfcp2l1 expression in 46C mESCs deprived of LIF for 12 h. Data represent mean±s.d. of three biological replicates. (B) Alkaline phosphatase staining of i-Tfcp2l1 mESCs cultured in the absence or presence of different concentrations of Dox for 8 days. (C) Quantification of alkaline phosphatase-positive colonies. Data represent mean±s.d. from triplicate experiments. (D) qRT–PCR analysis of Tfcp2l1 in i-Tfcp2l1 mESCs cultured in the indicated conditions for 12 h. (E) Morphology of i-EGFP and i-Tfcp2l1 mESCs cultured in serum medium without LIF for 8 days. Scale bar, 100 μm. (F) Immunostaining of i-Tfcp2l1 mESCs after 8 days in the presence or absence of Dox. Scale bar, 100 μm. (G) Western blot analysis of Tfcp2l1 expression in empty or Tfcp2l1 vector-transfected Stat3 knockout ESCs cultured in N2B27/2i. (H) Morphology and alkaline phosphatase staining of Stat3 knockout ESCs transfected with empty or Tfcp2l1 vector and cultured in serum without LIF for one passage. Scale bar, 100 μm. (I) mESCs were deprived of LIF for 12 h, and then treated with indicated kinase inhibitors for 1 h before LIF stimulation for 12 h, as indicated on timeline (lower right). Socs3 and Tfcp2l1 transcripts were evaluated at −1, 1, and 12 h by qRT–PCR. Data represent mean±s.d. of three biological replicates. Source data for this figure is available on the online supplementary information page.
Figure 4
PD03, CHIR, and LIF induce Tfcp2l1 independently. (A–C) mESCs were deprived of LIF for 12 h, and then treated with 1 μm 53AH, 10 μM JAK inhibitor I, or 20 ng/ml bFGF for 1 h before LIF, CHIR, or PD03 stimulation. Egr1, Axin2, Socs3, and Tfcp2l1 transcript levels were evaluated 12 h later by qRT–PCR. Data represent mean±s.d. of three biological replicates.
Figure 5
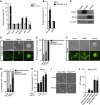
Knockdown of Tfcp2l1 impairs Stat3- but not 2i-mediated mESC self-renewal. (A) qRT–PCR analysis of Tfcp2l1 expression in shRNA knockdown cells. The transcript level was normalized against scramble shRNA control. Data represent mean±s.d. of three biological replicates. (B) Alkaline phosphatase staining of shTfcp2l1 mESC colonies cultured in serum/LIF condition for 8 days. Scale bar, 100 μm. (C) Quantification of alkaline phosphatase-positive shTfcp2l1 mESC colonies. Data represent mean±s.d. from triplicate experiments. (D) qRT–PCR analysis of ESC pluripotency marker (Oct4, Sox2, Nanog, Klf4, and Tbx3) and differentiation-associated gene (Cdx2, Nestin, T, Gata6, and FoxA2) expression in shTfcp2l1 ESCs cultured in the presence of LIF. Transcript levels were normalized against scramble shRNA control. Data represent mean±s.d. of three biological replicates. (E, F) Alkaline phosphatase staining and quantification of alkaline phosphatase-positive empty vector and mutant-Tfcp2l1 (Tfcp2l1mut) colonies transfected with Tfcp2l1 shRNA lentivirus and cultured in serum/LIF medium. Scale bar, 100 μm. (G) qRT–PCR analysis of Tfcp2l1 expression in Tfcp2l1 shRNA knockdown and scramble shRNA control cells cultured in serum/LIF or N2B27/2i. Data represent mean±s.d. of three biological replicates. (H) Alkaline phosphatase staining of shTfcp2l1 mESC colonies cultured in N2B27/2i for five passages. Scale bar, 100 μm.
Figure 6
Tfcp2l1 reprograms EpiSCs to naïve pluripotency. (A) 46C mESCs and 46C-derived embryoid bodies were harvested. Oct4, Nanog, and Tfcp2l1 transcript levels were analysed by qRT–PCR. Data represent mean±s.d. of three biological replicates. (B) Morphology and alkaline phosphatase staining of 46C mESCs and 46C mESC-derived EpiSCs cultured in Activin A, bFGF, and 53AH for eight passages. Scale bar represents 100 μm. (C) Expression patterns of Tfcp2l1, Nanog, Rex1, and Fgf5 in 46C mESCs and EpiSCs. Data represent mean±s.d. of three biological replicates. (D) Western blot analysis of Tfcp2l1 in 46C EpiSCs with stable Tfcp2l1 transgene expression. (E) Morphology of empty and Tfcp2l1 vector EpiSC transfectants cultured in serum medium supplemented with LIF/2i for 8 days. Scale bar represents 100 μm. (F) Alkaline phosphatase staining of Tfcp2l1 EpiSCs and three Tfcp2l1 Epi-iPSC (induced pluripotent stem cell) clones. Scale bar represents 100 μm. (G, H) 105 empty and Tfcp2l1 vector-transfected CD1 EpiSCs cultured in serum medium supplemented with LIF/2i. After 10 days, alkaline phosphatase-positive colonies were photographed and counted under a microscope. Scale bar represents 100 μm. (I) Comparison of gene marker expression in Tfcp2l1 Epi-iPS cells and CD1 EpiSCs. Nanog, Klf2, Klf4, Nr0b1, Rex1, and Stella are ESC markers, whereas Fgf5 and Otx2 are EpiSC markers. Data represent mean±s.d. of three biological replicates. Source data for this figure is available on the online supplementary information page.
Figure 7
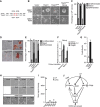
Nanog is critical for the function of Tfcp2l1 in mESCs. (A) qRT–PCR analysis of Tfcp2l1, Oct4, Sox2, Nanog, Klf4, and Tbx3 expression in i-Tfcp2l1 mESCs cultured in the presence or absence of Dox for 12 h. Data represent mean±s.d. of three biological replicates. (B) qRT–PCR analysis of Nanog and Oct4 gene expression in 46C mESCs cultured in the presence of LIF with or without PD03 for 12 h. (C) Expression vectors for Tfcp2l1 or Nanog were introduced into Nanog-null mESCs, and the protein levels were assayed by western blotting. (D, E) Morphology and quantification of alkaline phosphatase-positive Nanog-null mESC colonies expressing Tfcp2l1 or Nanog transgene cultured in N2B27/CHIR. Nanog-null mESCs are GFP positive. Scale bar, 100 μm. Data represent mean±s.d. from triplicate experiments. (F, G) Morphology and quantification of alkaline phosphatase-positive Nanog-null mESC colonies expressing Tfcp2l1 or Nanog transgene cultured in serum medium. Scale bar represents 100 μm. (H) Nanog expression in i-Tfcp2l1 mESCs treated with different concentrations of Dox. Data represent mean±s.d. of three biological replicates. (I) Morphology of Nanog-overexpressing or empty vector control 46C mESCs infected with scramble or Tfcp2l1 shRNA lentivirus. Scale bar, 100 μm. (J) 46C EpiSCs transfected with indicated constructs were cultured in 2i/LIF for 10 days and stained for alkaline phosphatase activity. Alkaline phosphatase-positive colonies were quantified. Data represent mean±s.d. from triplicate experiments. Source data for this figure is available on the online supplementary information page.
Figure 8
DNA-binding activity is required for the function of Tfcp2l1 in mESCs. (A) BLAST protein sequence of Tfcp2 (amino acids 230–240) and Tfcp2l1 (amino acids 210–220). (B, C) Morphology and quantification of alkaline phosphatase-positive colonies arising from empty vector, Tfcp2l1, and Tfcp2l12mut transfectants cultured in N2B27/CHIR or N2B27/PD03 for three passages. Scale, 100 μm. Data represent mean±s.d. from triplicate experiments. (D, E) Alkaline phosphatase staining and quantification of positive colonies arising from empty vector, Tfcp2l1 and Tfcp2l12mut transfectants cultured in serum medium for 10 days. Scale bar, 100 μm. Data represent mean±s.d. from triplicate experiments. (F) qRT–PCR analysis of Nanog expression in empty vector, Tfcp2l1, and Tfcp2l12mut transfectants after withdrawal of LIF for 12 h (Serum) or in the presence of LIF (Serum/LIF). Data represent mean±s.d. of three biological replicates. (G) Luciferase reporter assays of Nanog promoter construct transiently transfected into empty vector, Tfcp2l1 and Tfcp2l12mut mESCs. Data represent mean±s.d. from triplicate experiments. (H) Morphology of different CP2 family member transfectants cultured for three passages in normal mESC medium without LIF or in N2B27 with CHIR or PD03. Scale bars, 100 μm. (I) Gene signal intensities of different CP2 family members in C57BL/6 mESCs cultured in LIF or LIF/2i. (J) Tfcp2l1 at the crossroads of LIF/Stat3, Wnt/β-catenin, and FGF/MEK signalling pathways. Tfcp2l1 expression is independently induced by LIF, CHIR, and PD03 by activation of Stat3, activation of Wnt/β-catenin, and suppression of FGF/MEK pathways, respectively. Elevated Tfcp2l1 expression can recapitulate the separate effects of LIF and PD03, and partially that of CHIR, in promoting mESC self-renewal. Tfcp2l1 induces and requires Nanog expression for its self-renewal-promoting effect.
Similar articles
- Identification of the missing pluripotency mediator downstream of leukaemia inhibitory factor.
Martello G, Bertone P, Smith A. Martello G, et al. EMBO J. 2013 Oct 2;32(19):2561-74. doi: 10.1038/emboj.2013.177. Epub 2013 Aug 13. EMBO J. 2013. PMID: 23942233 Free PMC article. - Tuning of β-catenin activity is required to stabilize self-renewal of rat embryonic stem cells.
Meek S, Wei J, Sutherland L, Nilges B, Buehr M, Tomlinson SR, Thomson AJ, Burdon T. Meek S, et al. Stem Cells. 2013 Oct;31(10):2104-15. doi: 10.1002/stem.1466. Stem Cells. 2013. PMID: 23843312 - Requirement for STAT3 and its target, TFCP2L1, in self-renewal of naïve pluripotent stem cells in vivo and in vitro.
Kraunsoe S, Azami T, Pei Y, Martello G, Jones K, Boroviak T, Nichols J. Kraunsoe S, et al. Biol Open. 2023 Jan 1;12(1):bio059650. doi: 10.1242/bio.059650. Epub 2023 Jan 17. Biol Open. 2023. PMID: 36504370 Free PMC article. - Regulation of embryonic stem cell self-renewal and pluripotency by leukaemia inhibitory factor.
Hirai H, Karian P, Kikyo N. Hirai H, et al. Biochem J. 2011 Aug 15;438(1):11-23. doi: 10.1042/BJ20102152. Biochem J. 2011. PMID: 21793804 Free PMC article. Review. - The Art of Capturing Pluripotency: Creating the Right Culture.
Ying QL, Smith A. Ying QL, et al. Stem Cell Reports. 2017 Jun 6;8(6):1457-1464. doi: 10.1016/j.stemcr.2017.05.020. Stem Cell Reports. 2017. PMID: 28591647 Free PMC article. Review.
Cited by
- TFCP2L1 drives stemness and enhances their resistance to Sorafenib treatment by modulating the NANOG/STAT3 pathway in hepatocellular carcinoma.
Qiu D, Wang T, Xiong Y, Li K, Qiu X, Feng Y, Lian Q, Qin Y, Liu K, Zhang Q, Jia C. Qiu D, et al. Oncogenesis. 2024 Sep 12;13(1):33. doi: 10.1038/s41389-024-00534-1. Oncogenesis. 2024. PMID: 39266516 Free PMC article. - A novel chemical genetic approach reveals paralog-specific role of ERK1/2 in mouse embryonic stem cell fate control.
Hu L, Xiao X, Huang W, Zhou T, Chen W, Zhang C, Ying QL. Hu L, et al. Front Cell Dev Biol. 2024 Jul 12;12:1415621. doi: 10.3389/fcell.2024.1415621. eCollection 2024. Front Cell Dev Biol. 2024. PMID: 39071800 Free PMC article. - Adaptive introgression reveals the genetic basis of a sexually selected syndrome in wall lizards.
Feiner N, Yang W, Bunikis I, While GM, Uller T. Feiner N, et al. Sci Adv. 2024 Apr 5;10(14):eadk9315. doi: 10.1126/sciadv.adk9315. Epub 2024 Apr 3. Sci Adv. 2024. PMID: 38569035 Free PMC article. - Hypoxia-induced immortalization of primary cells depends on Tfcp2L1 expression.
Otero-Albiol D, Santos-Pereira JM, Lucena-Cacace A, Clemente-González C, Muñoz-Galvan S, Yoshida Y, Carnero A. Otero-Albiol D, et al. Cell Death Dis. 2024 Feb 28;15(2):177. doi: 10.1038/s41419-024-06567-z. Cell Death Dis. 2024. PMID: 38418821 Free PMC article. - 3D Enhancer-promoter networks provide predictive features for gene expression and coregulation in early embryonic lineages.
Murphy D, Salataj E, Di Giammartino DC, Rodriguez-Hernaez J, Kloetgen A, Garg V, Char E, Uyehara CM, Ee LS, Lee U, Stadtfeld M, Hadjantonakis AK, Tsirigos A, Polyzos A, Apostolou E. Murphy D, et al. Nat Struct Mol Biol. 2024 Jan;31(1):125-140. doi: 10.1038/s41594-023-01130-4. Epub 2023 Dec 5. Nat Struct Mol Biol. 2024. PMID: 38053013 Free PMC article.
References
- Aksoy I, Sakabedoyan C, Bourillot PY, Malashicheva AB, Mancip J, Knoblauch K, Afanassieff M, Savatier P (2007) Self-renewal of murine embryonic stem cells is supported by the serine/threonine kinases Pim-1 and Pim-3. Stem Cells 25: 2996–3004 - PubMed
- Bain G, Kitchens D, Yao M, Huettner JE, Gottlieb DI (1995) Embryonic stem cells express neuronal properties in vitro. Dev Biol 168: 342–357 - PubMed
- Bourillot PY, Aksoy I, Schreiber V, Wianny F, Schulz H, Hummel O, Hubner N, Savatier P (2009) Novel STAT3 target genes exert distinct roles in the inhibition of mesoderm and endoderm differentiation in cooperation with Nanog. Stem Cells 27: 1760–1771 - PubMed
- Buehr M, Meek S, Blair K, Yang J, Ure J, Silva J, McLay R, Hall J, Ying QL, Smith A (2008) Capture of authentic embryonic stem cells from rat blastocysts. Cell 135: 1287–1298 - PubMed
- Cartwright P, McLean C, Sheppard A, Rivett D, Jones K, Dalton S (2005) LIF/STAT3 controls ES cell self-renewal and pluripotency by a Myc-dependent mechanism. Development 132: 885–896 - PubMed
MeSH terms
Substances
LinkOut - more resources
Full Text Sources
Other Literature Sources
Molecular Biology Databases
Research Materials
Miscellaneous


