Voltage-dependent intrinsic bursting in olfactory bulb Golgi cells - PubMed (original) (raw)
Voltage-dependent intrinsic bursting in olfactory bulb Golgi cells
R Todd Pressler et al. Learn Mem. 2013.
Abstract
In the mammalian olfactory bulb (OB), local synaptic circuits modulate the evolving pattern of activity in mitral and tufted cells following olfactory sensory stimulation. GABAergic granule cells, the most numerous interneuron subtype in this brain region, have been extensively studied. However, classic studies using Golgi staining methods identified many other, nongranule cell types in the OB whose function remains mysterious. Within just the granule cell layer (GCL), Ramón y Cajal described multiple morphologically distinct subtypes of nongranule interneurons including large spiny Blanes cells which exhibit intrinsic persistent activity. Here, we define the intrinsic electrophysiology of a different nongranule interneuronal cell type in the GCL described by Ramón y Cajal, sparsely spiny Golgi cells in the rat OB. Golgi cells exhibit two distinct firing modes depending on the membrane potential: tonic firing and bursting. Golgi cells also generate rebound bursts following the offset of hyperpolarizing steps. We find that both low-threshold burst responses to depolarizing inputs and rebound bursts are blocked by nickel, an antagonist of T-type voltage-gated Ca2+ current. The state-dependent firing behavior we report in OB Golgi cells suggests that the function of these interneurons may dynamically shift from providing rhythmic potent inhibition of postsynaptic target neurons at sniffing frequencies to tonic, subtractive inhibition based on centrifugal modulatory input.
Figures
Figure 1.
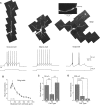
Morphology and intrinsic properties of neurons in the granule cell layer. (A) Reconstructions of three different GCL neurons recorded intracellularly and filled with Alexa594. Neurons were imaged in live brain slices using 2-photon microscopy. Image montages were created from multiple maximal _Z_-stack projections. Calibration bar represents 50 µm in each montage and 10 µm in the enlargement of the Golgi cell dendrite shown in the inset. Example response to 1-sec duration depolarizing steps are shown below each montage. The membrane potential at the beginning of each episode is indicated below trace. (B) Sholl analysis of dendritic arborization calculated from six Golgi cells. (C) Plot of the frequency of dendritic bifurcations from Sholl analysis 50 µm from the cell body in Golgi cells (GoC, n = 6), granule cells (GC, n = 7), and Blanes cells (BC, n = 9). (**) P < 0.02. (D) Plot of frequency of dendritic bifurcations 200 µm from the cell body in the same neuron classes. (***) P < 0.001. Granule and Blanes cell reconstructions analyzed to compare with Golgi cells were obtained as part of a previous study (Pressler and Strowbridge 2006).
Figure 2.
Afterpotentials associated with different granule cell layer neuron types. (A) Example responses to depolarizing current steps in three types of GCL neurons. Action potentials truncated. (B) Plot of afterpotential amplitude assayed 500 msec following step offset. Number of cells tested are indicated within each bar. Golgi cells did not generate an afterpotential to the standardized depolarizing test stimulus (mean amplitude 0.0 mV, n = 10 cells). (**) P < 0.002, (***) P < 0.0001.
Figure 3.
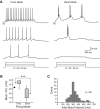
Voltage-dependent burst responses in Golgi cells. (A) Responses to the same series of graded depolarizing current steps at two different membrane potentials in one Golgi cell. (B) Plot of firing mode (bursting or tonic firing) associated with different membrane potentials in recordings from 13 Golgi cells. Vertical lines indicate range over all membrane potentials, and filled rectangles represent 95% confidence intervals of the mean. The membrane potential mean ± SEM for each firing mode over 13 Golgi cells is plotted outside filled rectangles. The average resting potential of Golgi cells without added bias current is indicated by horizontal arrow inside Y axis. (***) P < 0.0001. (C) Histogram of intervals between bursts in trials in which depolarizing current steps triggered more than one burst response.
Figure 4.
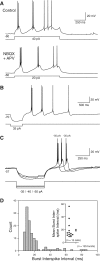
Properties of Golgi cell burst responses. (A) Responses to depolarizing current steps before and after bath application of ionotropic glutamatergic receptor antagonists NBQX (5 µM) and
d
-APV (25 µM). (B) Example of repetitive burst responses triggered by a single hyperpolarizing current step. (C) All-or-none burst rebound responses triggered by graded hyperpolarizing current steps. (D) Histogram of inter-spike intervals within all-or-none bursts from 13 Golgi cells. (Inset) Distribution of burst inter-spike intervals in each Golgi cell analyzed. Overall mean ± SEM plotted to the right of the scatter plot.
Figure 5.
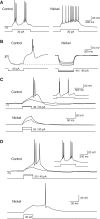
Attenuation of Golgi cell burst responses by nickel. (A) Responses to the same depolarizing step response before and after bath application of nickel. (B) Nickel (100–200 µM) blocked rebound bursts triggered by hyperpolarizing steps. (C) Burst response triggered by short-duration (50 msec) depolarizing current step. Spiking associated with burst response occurred after current step. Nickel blocked both regenerative depolarizing envelope and spiking associated with burst response. (D) Effect of nickel in a different Golgi cell. While nickel blocked spiking associated with the burst response, nickel did not eliminate regenerative depolarization which was maintained following step offset. Response to 1-sec duration current step in control conditions shown in inset.
Figure 6.
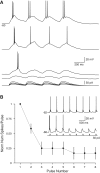
Voltage-dependent adaptation to phasic stimuli. (A) Responses to trains of α-function of graded amplitude in a Golgi cell. Bursts were reliably triggered only by the first α-function stimulus and burst latency was modulated by stimulus amplitude. (B) Plot of number of action potentials evoked by each current pulse in a train of eight pulses at −68 mV. The number of spikes in each response was normalized to the number of spikes evoked by the first pulse in each train. Mean ± SEM plotted for six repetitions of the same stimulus train. (Inset) Responses to a single train at −68 mV, illustrating burst adaptation. Responses to current pulses presented at −62 mV triggered single-spike responses that did not adapt.
Similar articles
- Activation of Granule Cell Interneurons by Two Divergent Local Circuit Pathways in the Rat Olfactory Bulb.
Pressler RT, Strowbridge BW. Pressler RT, et al. J Neurosci. 2020 Dec 9;40(50):9701-9714. doi: 10.1523/JNEUROSCI.0989-20.2020. Epub 2020 Nov 24. J Neurosci. 2020. PMID: 33234611 Free PMC article. - Electrophysiology of interneurons in the glomerular layer of the rat olfactory bulb.
McQuiston AR, Katz LC. McQuiston AR, et al. J Neurophysiol. 2001 Oct;86(4):1899-907. doi: 10.1152/jn.2001.86.4.1899. J Neurophysiol. 2001. PMID: 11600649 - Functional Specialization of Interneuron Dendrites: Identification of Action Potential Initiation Zone in Axonless Olfactory Bulb Granule Cells.
Pressler RT, Strowbridge BW. Pressler RT, et al. J Neurosci. 2019 Dec 4;39(49):9674-9688. doi: 10.1523/JNEUROSCI.1763-19.2019. Epub 2019 Oct 29. J Neurosci. 2019. PMID: 31662426 Free PMC article. - A specific olfactory bulb interneuron subtype Tpbg/5T4 generated at embryonic and neonatal stages.
Tsuboi A. Tsuboi A. Front Neural Circuits. 2024 Jun 12;18:1427378. doi: 10.3389/fncir.2024.1427378. eCollection 2024. Front Neural Circuits. 2024. PMID: 38933598 Free PMC article. Review. - Inhibitory circuits of the mammalian main olfactory bulb.
Burton SD. Burton SD. J Neurophysiol. 2017 Oct 1;118(4):2034-2051. doi: 10.1152/jn.00109.2017. Epub 2017 Jul 19. J Neurophysiol. 2017. PMID: 28724776 Free PMC article. Review.
Cited by
- Developmentally defined forebrain circuits regulate appetitive and aversive olfactory learning.
Muthusamy N, Zhang X, Johnson CA, Yadav PN, Ghashghaei HT. Muthusamy N, et al. Nat Neurosci. 2017 Jan;20(1):20-23. doi: 10.1038/nn.4452. Epub 2016 Dec 5. Nat Neurosci. 2017. PMID: 27918532 Free PMC article. - Respiratory modulation of spontaneous subthreshold synaptic activity in olfactory bulb granule cells recorded in awake, head-fixed mice.
Youngstrom IA, Strowbridge BW. Youngstrom IA, et al. J Neurosci. 2015 Jun 10;35(23):8758-67. doi: 10.1523/JNEUROSCI.0311-15.2015. J Neurosci. 2015. PMID: 26063910 Free PMC article. - Rapid Feedforward Inhibition and Asynchronous Excitation Regulate Granule Cell Activity in the Mammalian Main Olfactory Bulb.
Burton SD, Urban NN. Burton SD, et al. J Neurosci. 2015 Oct 21;35(42):14103-22. doi: 10.1523/JNEUROSCI.0746-15.2015. J Neurosci. 2015. PMID: 26490853 Free PMC article. - Active Dendrites and Differential Distribution of Calcium Channels Enable Functional Compartmentalization of Golgi Cells.
Rudolph S, Hull C, Regehr WG. Rudolph S, et al. J Neurosci. 2015 Nov 25;35(47):15492-504. doi: 10.1523/JNEUROSCI.3132-15.2015. J Neurosci. 2015. PMID: 26609148 Free PMC article. - Post-Inhibitory Rebound Firing of Dorsal Root Ganglia Neurons.
Zhu T, Wei S, Wang Y. Zhu T, et al. J Pain Res. 2022 Jul 26;15:2029-2040. doi: 10.2147/JPR.S370335. eCollection 2022. J Pain Res. 2022. PMID: 35923842 Free PMC article.
References
- Alonso JR, Briñón JG, Crespo C, Bravo IG, Arévalo R, Aijón J 2001. Chemical organization of the macaque monkey olfactory bulb: II. Calretinin, calbindin D-28k, parvalbumin, and neurocalcin immunoreactivity. J Comp Neurol 432: 389–407 - PubMed
- Aungst JL, Heyward PM, Puche AC, Karnup SV, Hayar A, Szabo G, Shipley MT 2003. Centre-surround inhibition among olfactory bulb glomeruli. Nature 426: 623–629 - PubMed
- Balu R, Strowbridge BW 2007. Opposing inward and outward conductances regulate rebound discharges in olfactory mitral cells. J Neurophysiol 97: 1959–1968 - PubMed
- Balu R, Larimer P, Strowbridge BW 2004. Phasic stimuli evoke precisely timed spikes in intermittently discharging mitral cells. J Neurophysiol 92: 743–753 - PubMed
Publication types
MeSH terms
LinkOut - more resources
Full Text Sources
Other Literature Sources
Miscellaneous
