Clathrin-mediated endocytosis persists during unperturbed mitosis - PubMed (original) (raw)
Clathrin-mediated endocytosis persists during unperturbed mitosis
Silvia K Tacheva-Grigorova et al. Cell Rep. 2013.
Abstract
How does mitosis influence the critical process of endocytosis? Some experiments lead to the conclusion that endocytosis arrests completely during mitosis, whereas others indicate that endocytosis persists. We have resolved this apparent discrepancy by showing how conditions of the experiment influence its outcome. The dynamics of clathrin-coated pit formation and the uptake of transferrin are maintained in naturally dividing cells but are nearly absent in mitotic cells arrested chemically by treatment with nocodazole, S-Trityl-L-cysteine, or RO-3306. Moreover, sequentially incubating cells at 4°C and then shifting them to 37°C or to serum starvation artificially increases the amount of transferrin receptor at the surface of naturally dividing cells, leading to the incorrect conclusion that endocytosis has ceased during mitosis. Thus, our data show that endocytosis is unaffected during all stages of natural cell division.
Copyright © 2013 The Authors. Published by Elsevier Inc. All rights reserved.
Figures
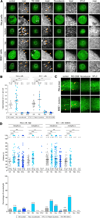
Figure 1. Coat Dynamics Are Not Affected during Natural Mitosis
(A) Schematic representation of the 3D visualization strategy used to image metaphase cells, and visualization examples showing AP2 spots corresponding to endocytic clathrin/AP2-coated pits and vesicles (arrowheads); z stacks were obtained by imaging sequential planes spaced 0.5 µm apart. The examples correspond to images obtained by spinning-disc confocal fluorescence microscopy from the top and bottom surfaces and the middle equatorial planes of metaphase HeLa and BSC1 cells stably expressing σ2-EGFP. The scale bar represents 10 µm. (B) Surface density of clathrin/AP2-coated structures (CCS/100 µm2) calculated from the number of AP2 spots at the top and bottom surfaces of HeLa and BSC1 cells imaged during interphase, metaphase, and cytokinesis prior to abscission. Bars and numerical values are averages ± SD; n, number of cells; ns, no statistical difference (p > 0.05). (C) Total number of clathrin/AP2-coated structures (CCS per cell) on the plasma membrane of a cell as determined by counting the number of fluorescent AP2 spots detected in each whole z stack obtained by 3D live-cell imaging. Bars and numerical values are averages ± SD; n, number of cells; ***p < 0.0001. (D) Schematic representation of the 4D visualization strategy. The examples are kymograph representations obtained from 2D time series corresponding to maximum-intensity z-projection sets from 4D time series acquired using spinning-disc confocal microscopy. The examples illustrate the temporal behavior of AP2 spots at the top and bottom surfaces of HeLa and BSC1 cells stably expressing σ2-EGFP. Orange and white arrowheads highlight canonical coated pits and plaques, respectively. (E) Upper panel: plot of the individual lifetimes of clathrin/AP2 pits from HeLa and BSC1 cells calculated from 4D time series obtained from the bottom and top surfaces during metaphase and cytokinesis, or from 2D and 4D time series from the bottom and top surfaces of interphase cells. At least five cells were imaged for each condition. Bars and numerical values are averages ± SD; n, number of AP2 spots. Lower panel: fraction of AP2 spots (percentage of arrested pits) whose lifetime was longer than the time series (120 s) corresponding to the data in the upper panel. (F) Plot of individual maximum fluorescence signals of AP2 spots obtained from the time series used to calculate the data in (E).
Figure 2. Absence of Coat Dynamics in Chemically Arrested Mitotic Cells
(A) Images obtained by spinning-disc confocal fluorescence microscopy from the top and bottom surfaces and middle equatorial planes of HeLa and BSC1 cells stably expressing σ2-EGFP undergoing natural mitosis (control), during the washout period after treatment with RO-3306, or after chemical arrest during mitosis by nocodazole or STLC treatment. Examples of AP2 spots (orange arrowheads) are shown. Note the complete absence of clathrin/AP2-coated pits and vesicles in mitotic cells arrested by nocodazole or STLC. RO-3306 treatment results in the formation of large intracellular vacuoles (white arrowheads). The scale bar represents 10 µm. (B) Total number of clathrin/AP2 structures (CCS per cell) on the plasma membrane of the cell as determined by counting the number of fluorescent AP2 spots detected in the complete z stack of each cell obtained by 3D live-cell imaging. Averages ± SD; n, number of cells; ***p < 0.0001. (C) Representative kymographs showing clathrin/AP2 dynamics from 4D time series obtained by live-cell spinning disc confocal acquired from the top of HeLa or bottom surfaces of BSC1 cells stably expressing σ2-EGFP during natural mitosis (control), mitotic cells imaged during the washout period after treatment with RO-3306, or mitotic cells arrested by incubation with nocodazole or STLC. Examples of AP2 tracks are highlighted (arrowhead). (D) Upper panel: plot of the individual lifetimes of clathrin/AP2 pits from HeLa and BSC1 cells calculated from 4D time series obtained from the bottom and top surface of metaphase or from 2D and 4D time series from the top and bottom surfaces of interphase cells. At least five cells were imaged for each condition. Bars and numerical values are averages ± SD; n, number of AP2 spots. Lower panel: fraction of AP2 spots whose lifetime was longer than the time series (120 s) used to calculate the data in the upper panel (percentage of arrested pits). ***p < 0.0001; ns, not significant (p > 0.05).
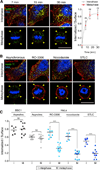
Figure 3. The Surface Expression of TfR Decreases Transiently in Cells Undergoing Natural Mitosis, but Not in Cells Arrested in Metaphase by Chemical Synchronization
(A) Representative images of HeLa, BSC1, HEK293, and RPE1 cells during interphase and metaphase undergoing natural mitosis, obtained by laser-scanning confocal microscopy. The views are from the bottom surface and the middle equatorial section of the same cell surface labeled with an antibody specific for the ectodomain of the TfR (green) and stained for DNA (blue). Note the significantly lower intensity of the fluorescence signal of TfR at the surface of naturally dividing metaphase cells (yellow arrowheads) compared with interphase cells (white arrowheads). The scale bar represents 10 µm. (B) Plot of the relative fluorescence signal of the antibody specific for the ectodomain of TfR determined during different stages of natural division of individual cells visualized as described in (A). Data for each cell type were normalized to the average intensity during interphase and correspond to a total of 55 and 43 cells in interphase and metaphase, respectively. (C) Data obtained by laser-scanning confocal microscopy of HeLa cells during interphase, during natural mitosis (asynchronous), synchronized in mitosis during the washout of RO-3306, and arrested in mitosis by treatment with nocodazole or STLC. Representative views show the surface content of TfR at the bottom surface and middle equatorial section of the same cell imaged using an antibody specific for the ectodomain of the TfR (surface TfR, green) and DNA (blue). Note the significantly lower fluorescence signal of TfR at the surface of naturally dividing metaphase cells (yellow arrowheads) compared with the higher signal in chemically treated metaphase cells (white arrowheads). The scale bar represents 10 µm. (D) Plot of the relative fluorescence signal of the antibody specific for the ectodomain of TfR in individual cells visualized as described in (A). Data for each condition were normalized to the average of the intensities of the control cells during interphase; 42 and 37 cells in interphase and metaphase, respectively, were analyzed. Bars are averages ± SD. ***p < 0.0001; ns, not significant (p > 0.05). See also Figure S1.
Figure 4. Effect of Chemical Synchronization on the Endocytic Rate of the TfR of Mitotic Cells
(A) Representative middle equatorial images of internalized Tf and TfR at the surface of BSC1 cells during interphase or undergoing natural mitosis after incubation for the indicated times with transferrin-Alexa488 (inside Tf; green) and subsequent antibody staining of TfR (surface TfR, red) and DNA (blue). Bar: 10 µm. The corresponding plot shows the ratio between the fluorescence signals of Tf and TfR at the cell surface calculated at the indicated times of continuous endocytosis. The amount of internalized Tf corresponds to the total value integrated throughout the whole volume of 40 and 36 cells in interphase (gray) and naturally dividing mitotic cells (red), respectively. The initial slope of the curves corresponds to the endocytic rate; data points are averages ± SD. ns, not significant (p > 0.05). (B) Representative middle-equatorial section images of internalized Tf and TfR at the cell surface in the absence or presence of RO-3306, nocodazole, or STLC. The images were obtained after incubation for 7 min with transferrin-Alexa488 (inside Tf, green) and subsequent staining for surface TfR (surface TfR, red) and DNA (blue). Note the accumulation of internalized Tf and low surface TfR in the asynchronous metaphase cell, and the absence of internalized Tf and high surface TfR in all chemically arrested mitotic cells. Scale bar, 10 µm. (C) Plot of endocytic rates obtained from the experiment described in (B). Bars are averages ± SD. ns, not significant (p > 0.05). ***p < 0.0001.
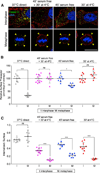
Figure 5. Increase in the Level of Surface TfR of Mitotic Cells Induced by a 4°C to 37°C Temperature Shift or by Incubation with Serum-Free Medium
(A) Representative middle-equatorial sections of BSC1 cells showing transferrin- Alexa488 (inside Tf; green) internalized after 7 min incubation at 37°C and subsequently stained with an antibody for cell-surface TfR (surface TfR; red) at 4°C for 30 min. Prior to these steps, cells were kept at 37°C (37°C direct) or incubated in serum-free medium for 45 min at 4°C (45′ serum free + 30′ at 4°C), in serum free-medium for 45 min at 37°C (45′ serum free), or with medium containing serum at 4°C for 30 min (30′at 4°C). Cells were also stained for DNA (blue). Note the significant increase of surface TfR in mitotic cells subjected to temperature shift or serum-free conditions. The scale bar represents 10 µm. (B) Plot of fluorescence signal corresponding to surface TfR for the experiment described in (A). Data for each condition were normalized to the average intensity of control interphase cells; 36 and 26 cells in interphase and metaphase, respectively, were analyzed. (C) Plot of endocytic rates obtained from the experiment described in (B). The values were obtained by integration of the fluorescence signals corresponding to internalized Tf and surface TfR throughout the whole cell volume; 36 and 26 cells in interphase and metaphase, respectively, were analyzed. Bars are averages ± SD. ns, not significant (p > 0.05); *p < 0.01; ***p < 0.0001.
Similar articles
- Probing Endocytosis During the Cell Cycle with Minimal Experimental Perturbation.
Santos AJM, Boucrot E. Santos AJM, et al. Methods Mol Biol. 2018;1847:23-35. doi: 10.1007/978-1-4939-8719-1_3. Methods Mol Biol. 2018. PMID: 30129007 - Clathrin-mediated endocytosis in AP-2-depleted cells.
Motley A, Bright NA, Seaman MN, Robinson MS. Motley A, et al. J Cell Biol. 2003 Sep 1;162(5):909-18. doi: 10.1083/jcb.200305145. J Cell Biol. 2003. PMID: 12952941 Free PMC article. - Regulation of clathrin-dependent endocytosis by diacylglycerol kinase delta: importance of kinase activity and binding to AP2alpha.
Kawasaki T, Kobayashi T, Ueyama T, Shirai Y, Saito N. Kawasaki T, et al. Biochem J. 2008 Jan 15;409(2):471-9. doi: 10.1042/BJ20070755. Biochem J. 2008. PMID: 17880279 - Mitotic inhibition of clathrin-mediated endocytosis.
Fielding AB, Royle SJ. Fielding AB, et al. Cell Mol Life Sci. 2013 Sep;70(18):3423-33. doi: 10.1007/s00018-012-1250-8. Epub 2013 Jan 11. Cell Mol Life Sci. 2013. PMID: 23307073 Free PMC article. Review. - Cargo recognition during clathrin-mediated endocytosis: a team effort.
Sorkin A. Sorkin A. Curr Opin Cell Biol. 2004 Aug;16(4):392-9. doi: 10.1016/j.ceb.2004.06.001. Curr Opin Cell Biol. 2004. PMID: 15261671 Review.
Cited by
- Autophagic flux is highly active in early mitosis and differentially regulated throughout the cell cycle.
Li Z, Ji X, Wang D, Liu J, Zhang X. Li Z, et al. Oncotarget. 2016 Jun 28;7(26):39705-39718. doi: 10.18632/oncotarget.9451. Oncotarget. 2016. PMID: 27213594 Free PMC article. - Regulation of EGFR Endocytosis by CBL During Mitosis.
Wee P, Wang Z. Wee P, et al. Cells. 2018 Dec 7;7(12):257. doi: 10.3390/cells7120257. Cells. 2018. PMID: 30544639 Free PMC article. - OR14I1 is a receptor for the human cytomegalovirus pentameric complex and defines viral epithelial cell tropism.
E X, Meraner P, Lu P, Perreira JM, Aker AM, McDougall WM, Zhuge R, Chan GC, Gerstein RM, Caposio P, Yurochko AD, Brass AL, Kowalik TF. E X, et al. Proc Natl Acad Sci U S A. 2019 Apr 2;116(14):7043-7052. doi: 10.1073/pnas.1814850116. Epub 2019 Mar 20. Proc Natl Acad Sci U S A. 2019. PMID: 30894498 Free PMC article. - Mitochondria chaperone GRP75 moonlighting as a cell cycle controller to derail endocytosis provides an opportunity for nanomicrosphere intracellular delivery.
Gao Z, Niu X, Zhang Q, Chen H, Gao A, Qi S, Xiang R, Belting M, Zhang S. Gao Z, et al. Oncotarget. 2017 Apr 19;8(35):58536-58552. doi: 10.18632/oncotarget.17234. eCollection 2017 Aug 29. Oncotarget. 2017. PMID: 28938577 Free PMC article. - Quantification of Internalized Silica Nanoparticles via STED Microscopy.
Peuschel H, Ruckelshausen T, Cavelius C, Kraegeloh A. Peuschel H, et al. Biomed Res Int. 2015;2015:961208. doi: 10.1155/2015/961208. Epub 2015 Jun 1. Biomed Res Int. 2015. PMID: 26125028 Free PMC article.
References
- Berlin RD, Oliver JM, Walter RJ. Surface functions during Mitosis I: phagocytosis, pinocytosis and mobility of surface-bound Con A. Cell. 1978;15:327–341. - PubMed
Publication types
MeSH terms
Substances
Grants and funding
- R01 GM075252/GM/NIGMS NIH HHS/United States
- U54 AI057159/AI/NIAID NIH HHS/United States
- GM-075252/GM/NIGMS NIH HHS/United States
- BB_/Biotechnology and Biological Sciences Research Council/United Kingdom
LinkOut - more resources
Full Text Sources
Other Literature Sources
Research Materials


