A flexible count data model to fit the wide diversity of expression profiles arising from extensively replicated RNA-seq experiments - PubMed (original) (raw)
A flexible count data model to fit the wide diversity of expression profiles arising from extensively replicated RNA-seq experiments
Mikel Esnaola et al. BMC Bioinformatics. 2013.
Abstract
Background: High-throughput RNA sequencing (RNA-seq) offers unprecedented power to capture the real dynamics of gene expression. Experimental designs with extensive biological replication present a unique opportunity to exploit this feature and distinguish expression profiles with higher resolution. RNA-seq data analysis methods so far have been mostly applied to data sets with few replicates and their default settings try to provide the best performance under this constraint. These methods are based on two well-known count data distributions: the Poisson and the negative binomial. The way to properly calibrate them with large RNA-seq data sets is not trivial for the non-expert bioinformatics user.
Results: Here we show that expression profiles produced by extensively-replicated RNA-seq experiments lead to a rich diversity of count data distributions beyond the Poisson and the negative binomial, such as Poisson-Inverse Gaussian or Pólya-Aeppli, which can be captured by a more general family of count data distributions called the Poisson-Tweedie. The flexibility of the Poisson-Tweedie family enables a direct fitting of emerging features of large expression profiles, such as heavy-tails or zero-inflation, without the need to alter a single configuration parameter. We provide a software package for R called tweeDEseq implementing a new test for differential expression based on the Poisson-Tweedie family. Using simulations on synthetic and real RNA-seq data we show that tweeDEseq yields P-values that are equally or more accurate than competing methods under different configuration parameters. By surveying the tiny fraction of sex-specific gene expression changes in human lymphoblastoid cell lines, we also show that tweeDEseq accurately detects differentially expressed genes in a real large RNA-seq data set with improved performance and reproducibility over the previously compared methodologies. Finally, we compared the results with those obtained from microarrays in order to check for reproducibility.
Conclusions: RNA-seq data with many replicates leads to a handful of count data distributions which can be accurately estimated with the statistical model illustrated in this paper. This method provides a better fit to the underlying biological variability; this may be critical when comparing groups of RNA-seq samples with markedly different count data distributions. The tweeDEseq package forms part of the Bioconductor project and it is available for download at http://www.bioconductor.org.
Figures
Figure 1
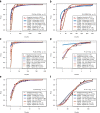
Fit of different count data distributions to diverse RNA-seq gene expression profiles. Fit of different count data distributions to the female (a, c, e) and male (b, d, f) RNA-seq expression profiles of genes EEF1A2(a, b), SCT(c, d) and NLGN4Y(e, f). All plots show the empirical cumulative distribution function (CDF) of counts (black dots) and the CDF estimated by a pure negative binomial model (black dashed line), a Poisson-Tweedie model (red line) obtained with
tweeDEseq
and several moderated negative binomial models obtained with different parameter configurations of
DESeq
and
edgeR
. Estimated dispersions, and shape in the case of
tweeDEseq
, are indicated in the legend. Above the legend, the _P_-value of the test of goodness-of-fit to a negative binomial distribution is shown. According to this test, expression profiles in panels (a, b, c and e) do not follow a negative binomial distribution. Female samples display non-negative binomial features such as a heavy-tail (a, c) and zero-inflation (c, e). Gene NLGN4Y is documented in the literature as a gene with sex-specific expression, while the other two are not (EEF1A2 is a housekeeping gene and SCT is an endocrine hormone peptide in chromosome 11 that controls secretions in the duodenum).
Figure 2
Count data normalization. MA-plots of the count data corresponding to the YRI samples from Pickrell [12]et al. (2010) after applying the following normalization methods: (a) raw count data without any normalization; (b) normalization with the
edgeR
[2] package; and (c) normalization with the
cqn
[4] package. The _x_-axis (A) shows the average expression throughout female and male samples in log2 scale and the _y_-axis (M) shows the magnitude of the log2-fold change between female and male samples.
Figure 3
Goodness of fit to the negative-binomial distribution. Quantile-quantile (Q-Q) plots of the goodness-of-fit of RNA-seq expression profiles from Pickrell [12]et al. (2010) to a negative-binomial (NB) distribution. The right _y_-axis indicates the quantile of the observed distribution. Columns correspond to different normalization methods where (a, d) correspond to raw un-normalized counts, (b, e) normalization with
edgeR
and (c, f) normalization with
cqn
. The top row (a, b, c) contains the Q-Q plots of the _χ_2 goodness-of-fit statistic while the bottom row (d, e, f) contains the same Q-Q plot mapped to a normalized Z-statistic to improve the visibility of the left tail of the distribution. Independently on how count data are normalized, about 10% of the expression profiles show a substantial discrepancy to the NB distribution.
Figure 4
Distribution of the Poisson-Tweedie shape parameter as function of the mean expression level. Estimated Poisson-Tweedie shape parameter a as function of the mean expression level for each gene. Red dashed lines indicate the value of a corresponding to each specific distribution within the Poisson-Tweedie family, denoted by Pois (Poisson), PIG (Poisson-Inverse Gaussian), NB (negative binomial), PA (Pólya-Aeppli) and NtA (Neyman type A). The right _y_-axis indicates the percentage of genes around specific a values bounded by dotted grey lines. Data from Pickrell [12]et al. (2010) are shown without any normalization (a), normalized with
edgeR
[2](b), and normalized with
cqn
[4](c).
Figure 5
Expression dynamics of genes with different count data distributions. Empirical cumulative distributions of the breadth of expression estimated through the Barcode [18] database, for genes that do not reject the null hypothesis of a negative-binomial (NB) distribution in a test for the goodness of fit at _P_>0.2 (green lines), genes that do reject such a null hypothesis at P<2−16 (blue lines) and housekeeping genes retrieved from literature [19] (red lines). Data from Pickrell [12]et al. (2010) are shown without any normalization (a), normalized with
edgeR
[2](b) and normalized with
cqn
[4](c). These plots show that, independently of the normalization method, non-NB genes at such significance level of discrepancy with respect to the NB distribution approach closer the expression dynamics of housekeeping genes than genes with expression profiles following the NB distribution.
Figure 6
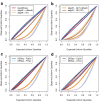
Quantile-quantile (Q-Q) plots for the goodness-of-fit of null-hypothesis P -values to an uniform distribution. Using the results displayed in Additional file 2: Figure S8 and performing as described by Leek et al. (2007) [20], for each gene, the distribution of _P_-values throughout the 100 simulations was tested for its goodness-of-fit to an uniform distribution using a Kolmogorov-Smirnov test. Q-Q plots in this figure show for all genes the resulting _P_-values of the previous test which, under the null hypothesis of no differential expression, should be uniformly distributed too and lead to lines lying on the diagonal. Panels a-b show results from female vs female comparisons and c-d from male vs male comparisons, while a,c correspond to un-normalized data and b,d to data normalized with the
cqn
[4]. The method introduced in this paper,
tweeDEseq
, is on average closer to the diagonal throughout the four simulations, closely followed by
DESeq
when
sharingMode=~gene-est-only~
and either
method=~per-condition~
or
method=~pooled~
.
Figure 7
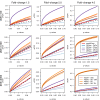
Empirical FDR values for simulated data with constant library factors. Empirical FDR values on the _y_-axis as function of nominal _q_-values on the _x_-axis calculated from data simulated with _p_=20,000 genes, _n_=70 samples and constant library factors. Each row and column corresponds, respectively, to a different number of DE genes and magnitude of the fold-change. The method introduced in this paper,
tweeDEseq
, is consistently closer to the diagonal than other methods throughout the different simulations.
Figure 8
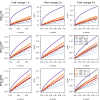
Empirical FDR values for simulated data with variable library factors. Empirical FDR values on the _y_-axis as function of nominal _q_-values on the _x_-axis calculated from data simulated with _p_=20,000 genes, _n_=70 samples and variable library factors. Each row and column corresponds, respectively, to a different number of DE genes and magnitude of the fold-change. The method introduced in this paper,
tweeDEseq
, is consistently closer to the diagonal than other methods throughout the different simulations.
Figure 9
Estimation of the number of differentially expressed (DE) genes from simulated data. Boxplots of ratios of estimated to true numbers of DE genes obtained from data simulated from a hierarchical gamma-Poisson model with constant (a) and variable (b) library factors. This figure summarizes the results in Additional file 2: Figures S9 and S10 reporting estimated numbers of DE genes under different simulated scenarios of number or true DE genes and fold-change. The horizontal dash line at ratio one corresponds to the best performance where the estimated number of DE genes matches the true number.
Figure 10
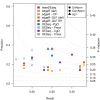
Precision and recall comparison on the LCL RNA-seq data. Precision (_y_-axis) and recall (_x_-axis) values for genes called DE at 1% FDR by different DE detection methods and configuration parameters. The right _y_-axis indicates values of the _F_-measure shown by dot lines. As the figure shows,
tweeDEseq
provides higher _F_-measure values than other methods indicating a better precision-recall tradeoff.
Figure 11
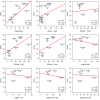
Reproducibility of differential expression (DE) between microarray and RNA-seq. Raw _P_-values of differential expression in − log10 scale for DE genes called at 10% FDR by both, limma (_y_-axis), from microarray data, and the other compared DE detection method applied on RNA-seq data (_x_-axis). A regression line is depicted in red. On the bottom-right corner of each panel, ρ indicates the Pearson correlation whereas _R_2 and P indicate, respectively, the coefficient of determination and _P_-value of the test for zero regression coefficient, of the − log10_p_-values of limma as function of those from the compared RNA-seq method. Only
tweeDEseq
provides a significant (p<0.05) level of reproducibility between _P_-values of DE genes reported by both, limma on microarray data and the compared RNA-seq method, attaining also the highest ρ and _R_2 values. Blue dots indicate genes with documented sex-specific expression.
Figure 12
Comparison of DE analyses between microarray and RNA-seq. Volcano plots of DE analyses performed on matching LCL samples profiled with RNA-seq (a) and gene expression microarrays (b). The _x_-axis corresponds to log2 fold-changes between female and male individuals while the _y_-axis corresponds to − log10_p_-value of significance. RNA-seq data were analysed with
tweeDEseq
while microarray data were analysed with
limma
. Grey dots indicate genes common to both, the RNA-seq and the microarray gene expression matrices, while black dots indicate genes occurring exclusively in one of the two data sets. Blue and red circles indicate genes documented in the literature with sex-specific expression, concretely belonging to the male-specific region of chromosome Y and escaping X-chromosome inactivation in females, respectively.
Similar articles
- Polyester: simulating RNA-seq datasets with differential transcript expression.
Frazee AC, Jaffe AE, Langmead B, Leek JT. Frazee AC, et al. Bioinformatics. 2015 Sep 1;31(17):2778-84. doi: 10.1093/bioinformatics/btv272. Epub 2015 Apr 28. Bioinformatics. 2015. PMID: 25926345 Free PMC article. - deGPS is a powerful tool for detecting differential expression in RNA-sequencing studies.
Chu C, Fang Z, Hua X, Yang Y, Chen E, Cowley AW Jr, Liang M, Liu P, Lu Y. Chu C, et al. BMC Genomics. 2015 Jun 13;16(1):455. doi: 10.1186/s12864-015-1676-0. BMC Genomics. 2015. PMID: 26070955 Free PMC article. - Power analysis and sample size estimation for RNA-Seq differential expression.
Ching T, Huang S, Garmire LX. Ching T, et al. RNA. 2014 Nov;20(11):1684-96. doi: 10.1261/rna.046011.114. Epub 2014 Sep 22. RNA. 2014. PMID: 25246651 Free PMC article. - Statistical detection of differentially expressed genes based on RNA-seq: from biological to phylogenetic replicates.
Gu X. Gu X. Brief Bioinform. 2016 Mar;17(2):243-8. doi: 10.1093/bib/bbv035. Epub 2015 Jun 24. Brief Bioinform. 2016. PMID: 26108230 Review. - Differential Expression Analysis of RNA-seq Reads: Overview, Taxonomy, and Tools.
Chowdhury HA, Bhattacharyya DK, Kalita JK. Chowdhury HA, et al. IEEE/ACM Trans Comput Biol Bioinform. 2020 Mar-Apr;17(2):566-586. doi: 10.1109/TCBB.2018.2873010. Epub 2018 Oct 1. IEEE/ACM Trans Comput Biol Bioinform. 2020. PMID: 30281477 Review.
Cited by
- Resistant starch slows the progression of CKD in the 5/6 nephrectomy mouse model.
Karaduta O, Glazko G, Dvanajscak Z, Arthur J, Mackintosh S, Orr L, Rahmatallah Y, Yeruva L, Tackett A, Zybailov B. Karaduta O, et al. Physiol Rep. 2020 Oct;8(19):e14610. doi: 10.14814/phy2.14610. Physiol Rep. 2020. PMID: 33038060 Free PMC article. - RNA-seq mixology: designing realistic control experiments to compare protocols and analysis methods.
Holik AZ, Law CW, Liu R, Wang Z, Wang W, Ahn J, Asselin-Labat ML, Smyth GK, Ritchie ME. Holik AZ, et al. Nucleic Acids Res. 2017 Mar 17;45(5):e30. doi: 10.1093/nar/gkw1063. Nucleic Acids Res. 2017. PMID: 27899618 Free PMC article. - Efficacy and safety of metabolic interventions for the treatment of severe COVID-19: in vitro, observational, and non-randomized open-label interventional study.
Ehrlich A, Ioannidis K, Nasar M, Abu Alkian I, Daskal Y, Atari N, Kliker L, Rainy N, Hofree M, Shafran Tikva S, Houri I, Cicero A, Pavanello C, Sirtori CR, Cohen JB, Chirinos JA, Deutsch L, Cohen M, Gottlieb A, Bar-Chaim A, Shibolet O, Mandelboim M, Maayan SL, Nahmias Y. Ehrlich A, et al. Elife. 2023 Jan 27;12:e79946. doi: 10.7554/eLife.79946. Elife. 2023. PMID: 36705566 Free PMC article. Clinical Trial. - Evaluation of methods for differential expression analysis on multi-group RNA-seq count data.
Tang M, Sun J, Shimizu K, Kadota K. Tang M, et al. BMC Bioinformatics. 2015 Nov 4;16:361. doi: 10.1186/s12859-015-0794-7. BMC Bioinformatics. 2015. PMID: 26538400 Free PMC article. - Selective forces and mutational biases drive stop codon usage in the human genome: a comparison with sense codon usage.
Trotta E. Trotta E. BMC Genomics. 2016 May 17;17:366. doi: 10.1186/s12864-016-2692-4. BMC Genomics. 2016. PMID: 27188984 Free PMC article.
References
Publication types
MeSH terms
LinkOut - more resources
Full Text Sources
Other Literature Sources
