Predictive functional profiling of microbial communities using 16S rRNA marker gene sequences - PubMed (original) (raw)
doi: 10.1038/nbt.2676. Epub 2013 Aug 25.
Jesse Zaneveld, J Gregory Caporaso, Daniel McDonald, Dan Knights, Joshua A Reyes, Jose C Clemente, Deron E Burkepile, Rebecca L Vega Thurber, Rob Knight, Robert G Beiko, Curtis Huttenhower
Affiliations
- PMID: 23975157
- PMCID: PMC3819121
- DOI: 10.1038/nbt.2676
Predictive functional profiling of microbial communities using 16S rRNA marker gene sequences
Morgan G I Langille et al. Nat Biotechnol. 2013 Sep.
Abstract
Profiling phylogenetic marker genes, such as the 16S rRNA gene, is a key tool for studies of microbial communities but does not provide direct evidence of a community's functional capabilities. Here we describe PICRUSt (phylogenetic investigation of communities by reconstruction of unobserved states), a computational approach to predict the functional composition of a metagenome using marker gene data and a database of reference genomes. PICRUSt uses an extended ancestral-state reconstruction algorithm to predict which gene families are present and then combines gene families to estimate the composite metagenome. Using 16S information, PICRUSt recaptures key findings from the Human Microbiome Project and accurately predicts the abundance of gene families in host-associated and environmental communities, with quantifiable uncertainty. Our results demonstrate that phylogeny and function are sufficiently linked that this 'predictive metagenomic' approach should provide useful insights into the thousands of uncultivated microbial communities for which only marker gene surveys are currently available.
Figures
Figure 1
The PICRUSt workflow. PICRUSt is composed of two high-level workflows: gene content inference (top box) and metagenome inference (bottom box). Beginning with a reference OTU tree and a gene content table (i.e., counts of genes for reference OTUs with known gene content), the gene content inference workflow predicts gene content for each OTU with unknown gene content, including predictions of marker gene copy number. This information is precomputed for 16S based on Greengenes and IMG, but all functionality is accessible in PICRUSt for use with other marker genes and reference genomes. The metagenome inference workflow takes an OTU table (i.e., counts of OTUs on a per sample basis), where OTU identifiers correspond to tips in the reference OTU tree, as well as the copy number of the marker gene in each OTU and the gene content of each OTU (as generated by the gene content inference workflow) and outputs a metagenome table (i.e. counts of gene families on a per-sample basis).
Figure 2
PICRUSt recapitulates biological findings from the Human Microbiome Project. A) PCA plot comparing KEGG Module predictions using 16S data with PICRUSt (lighter colored triangles) and sequenced shotgun metagenome (darker colored circles) along with relative abundances for five specific KEGG Modules, B) M00061: Uronic acid metabolism, C) M00076: Dermatan sulfate degradation, D) M00077: Chondroitin sulfate degradation, E) M00078: Heparan sulfate degradation, and F) M00079: Keratan sulfate degradation, all involved in glycosaminosglycan degradation (KEGG pathway ko00531) using 16S with PICRUSt (P, lighter colored) and WGS (W, darker colored) across human body sites: nasal (blue), gastrointestinal tract (brown), oral (green), skin (red), and vaginal (yellow).
Figure 3
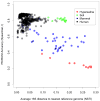
PICRUSt accuracy across various environmental microbiomes. Prediction accuracy for paired 16S rRNA marker gene surveys and shotgun metagenomes (y-axis) are plotted against the availability of reference genomes as summarized by the Nearest Sequenced Taxon Index (NSTI; x-axis). Accuracy is summarized using the Spearman correlation between the relative abundance of gene copy number predicted from 16S data using PICRUSt versus the relative abundance observed in the sequenced shotgun metagenome. In the absence of large differences in metagenomic sequencing depth (see text), relatively well-characterized environments, such as the human gut, have low NSTI values and can be predicted accurately from 16S surveys. Conversely, environments containing much unexplored diversity (e.g. phyla with few or no sequenced genomes), such as the Guerrero Negro hypersaline microbial mats, tended to have high NSTI values.
Figure 4
Accuracy of PICRUSt prediction compared with shotgun metagenomic sequencing at shallow sequencing depths. Spearman correlation (y-axis) between either PICRUSt predicted metagenomes (blue lines) or shotgun metagenomes (dashed red lines) using 14 soil microbial communities subsampled to the specified number of annotated sequences (x-axis). This rarefaction reflects random subsets of either the full 16S OTU table (blue) or the corresponding gene table for the sequenced metagenome (red). Ten randomly chosen rarefactions were performed at each depth to indicate the expected correlation obtained when assessing an underlying true metagenome using either shallow 16S rRNA gene sequencing with PICRUSt prediction or shallow shotgun metagenomic sequencing. The data label describes the number of annotated reads below which PICRUSt-prediction accuracy exceeds metagenome sequencing accuracy. Note that the plotted rarefaction depth reflects the number of 16S or metagenomic sequences remaining after standard quality control, dereplication, and annotation (or OTU picking in the case of 16S sequences), not the raw number returned from the sequencing facility. The number of total metagenomic reads below which PICRUSt outperforms metagenomic sequencing (72,650) for this dataset was calculated by adjusting the crossover point in annotated reads (above) using annotation rates for the soil dataset (17.3%) and closed-reference OTU picking rates for the 16S rRNA dataset (68.9%). The inset figure illustrates rapid convergence of PICRUSt predictions given low numbers of annotated reads (blue line).
Figure 5
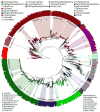
PICRUSt prediction accuracy across the tree of bacterial and archaeal genomes. Phylogenetic tree produced by pruning the Greengenes 16S reference tree down to those tips representing sequenced genomes. Height of the bars in the outermost circle indicates the accuracy of PICRUSt for each genome (accuracy: 0.5-1.0) colored by phylum, with text labels for each genus with at least 15 strains. PICRUSt predictions were as accurate for archaeal (mean=0.94 +/- 0.04 s.d., n=103) as bacterial genomes (mean=0.95 +/- 0.05 s.d., n=2487).
Figure 6
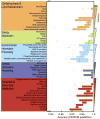
Variation in inference accuracy across functional modules within single genomes. Results are colored by functional category, and sorted in decreasing order of accuracy within each category (indicated by triangular bars, right margin). Note that all accuracies were >0.80, and therefore the region 0.80-1.0 is displayed for clearer visualization of differences between modules.
Similar articles
- Marker genes as predictors of shared genomic function.
Sevigny JL, Rothenheber D, Diaz KS, Zhang Y, Agustsson K, Bergeron RD, Thomas WK. Sevigny JL, et al. BMC Genomics. 2019 Apr 4;20(1):268. doi: 10.1186/s12864-019-5641-1. BMC Genomics. 2019. PMID: 30947688 Free PMC article. - Tax4Fun: predicting functional profiles from metagenomic 16S rRNA data.
Aßhauer KP, Wemheuer B, Daniel R, Meinicke P. Aßhauer KP, et al. Bioinformatics. 2015 Sep 1;31(17):2882-4. doi: 10.1093/bioinformatics/btv287. Epub 2015 May 7. Bioinformatics. 2015. PMID: 25957349 Free PMC article. - rpoB, a promising marker for analyzing the diversity of bacterial communities by amplicon sequencing.
Ogier JC, Pagès S, Galan M, Barret M, Gaudriault S. Ogier JC, et al. BMC Microbiol. 2019 Jul 29;19(1):171. doi: 10.1186/s12866-019-1546-z. BMC Microbiol. 2019. PMID: 31357928 Free PMC article. - Meta'omic analytic techniques for studying the intestinal microbiome.
Morgan XC, Huttenhower C. Morgan XC, et al. Gastroenterology. 2014 May;146(6):1437-1448.e1. doi: 10.1053/j.gastro.2014.01.049. Epub 2014 Jan 28. Gastroenterology. 2014. PMID: 24486053 Review. - High throughput sequencing methods for microbiome profiling: application to food animal systems.
Highlander SK. Highlander SK. Anim Health Res Rev. 2012 Jun;13(1):40-53. doi: 10.1017/S1466252312000126. Anim Health Res Rev. 2012. PMID: 22853944 Review.
Cited by
- Different sources of alfalfa hay alter the composition of rumen microbiota in mid-lactation Holstein cows without affecting production performance.
La S, Li H, Zhang Y, Abaidullah M, Niu J, Gao Z, Liu B, Ma S, Cui Y, Li D, Shi Y. La S, et al. Front Vet Sci. 2024 Oct 21;11:1433876. doi: 10.3389/fvets.2024.1433876. eCollection 2024. Front Vet Sci. 2024. PMID: 39497747 Free PMC article. - Changes in Symbiotic Microbiota and Immune Responses in Early Development Stages of Rapana venosa (Valenciennes, 1846) Provide Insights Into Immune System Development in Gastropods.
Yang MJ, Song H, Yu ZL, Hu Z, Zhou C, Wang XL, Zhang T. Yang MJ, et al. Front Microbiol. 2020 Jun 16;11:1265. doi: 10.3389/fmicb.2020.01265. eCollection 2020. Front Microbiol. 2020. PMID: 32612589 Free PMC article. - Dietary citrus pectin drives more ileal microbial protein metabolism and stronger fecal carbohydrate fermentation over fructo-oligosaccharide in growing pigs.
Zhang Y, Mu C, Liu S, Zhu W. Zhang Y, et al. Anim Nutr. 2022 Aug 17;11:252-263. doi: 10.1016/j.aninu.2022.08.005. eCollection 2022 Dec. Anim Nutr. 2022. PMID: 36263407 Free PMC article. - Local Geomorphological Gradients and Land Use Patterns Play Key Role on the Soil Bacterial Community Diversity and Dynamics in the Highly Endemic Indigenous Afrotemperate Coastal Scarp Forest Biome.
Ogola HJO, Selvarajan R, Tekere M. Ogola HJO, et al. Front Microbiol. 2021 Feb 24;12:592725. doi: 10.3389/fmicb.2021.592725. eCollection 2021. Front Microbiol. 2021. PMID: 33716998 Free PMC article. - Ecological significance of Synergistetes in the biological treatment of tuna cooking wastewater by an anaerobic sequencing batch reactor.
Militon C, Hamdi O, Michotey V, Fardeau ML, Ollivier B, Bouallagui H, Hamdi M, Bonin P. Militon C, et al. Environ Sci Pollut Res Int. 2015 Nov;22(22):18230-8. doi: 10.1007/s11356-015-4973-x. Epub 2015 Jul 22. Environ Sci Pollut Res Int. 2015. PMID: 26194235
References
Publication types
MeSH terms
Substances
Grants and funding
- P01 DK078669/DK/NIDDK NIH HHS/United States
- T32 GM008759/GM/NIGMS NIH HHS/United States
- R01HG004872/HG/NHGRI NIH HHS/United States
- CAPMC/ CIHR/Canada
- U01HG004866/HG/NHGRI NIH HHS/United States
- T32 GM080177/GM/NIGMS NIH HHS/United States
- R01 HG004872/HG/NHGRI NIH HHS/United States
- 1R01HG005969/HG/NHGRI NIH HHS/United States
- R01 HG005969/HG/NHGRI NIH HHS/United States
- T32 GM142607/GM/NIGMS NIH HHS/United States
- HHMI/Howard Hughes Medical Institute/United States
- U01 HG004866/HG/NHGRI NIH HHS/United States
- P01DK078669/DK/NIDDK NIH HHS/United States
LinkOut - more resources
Full Text Sources
Other Literature Sources


