The first peopling of South America: new evidence from Y-chromosome haplogroup Q - PubMed (original) (raw)
The first peopling of South America: new evidence from Y-chromosome haplogroup Q
Vincenza Battaglia et al. PLoS One. 2013.
Abstract
Recent progress in the phylogenetic resolution of the Y-chromosome phylogeny permits the male demographic dynamics and migratory events that occurred in Central and Southern America after the initial human spread into the Americas to be investigated at the regional level. To delve further into this issue, we examined more than 400 Native American Y chromosomes (collected in the region ranging from Mexico to South America) belonging to haplogroup Q - virtually the only branch of the Y phylogeny observed in modern-day Amerindians of Central and South America - together with 27 from Mongolia and Kamchatka. Two main founding lineages, Q1a3a1a-M3 and Q1a3a1-L54(xM3), were detected along with novel sub-clades of younger age and more restricted geographic distributions. The first was also observed in Far East Asia while no Q1a3a1-L54(xM3) Y chromosome was found in Asia except the southern Siberian-specific sub-clade Q1a3a1c-L330. Our data not only confirm a southern Siberian origin of ancestral populations that gave rise to Paleo-Indians and the differentiation of both Native American Q founding lineages in Beringia, but support their concomitant arrival in Mesoamerica, where Mexico acted as recipient for the first wave of migration, followed by a rapid southward migration, along the Pacific coast, into the Andean region. Although Q1a3a1a-M3 and Q1a3a1-L54(xM3) display overlapping general distributions, they show different patterns of evolution in the Mexican plateau and the Andean area, which can be explained by local differentiations due to demographic events triggered by the introduction of agriculture and associated with the flourishing of the Great Empires.
Conflict of interest statement
Competing Interests: SRW and NM are employed by a commercial company: Ancestry.com. This does not alter the authors' adherence to all the PLoS ONE policies on sharing data and materials.
Figures
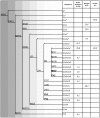
Figure 1. Phylogenetic tree of Y-chromosome haplogroup Q.
Haplogroup nomenclature and frequencies (%) of haplogroup branches in the analyzed populations (new markers are in bold). The haplogroup labeling is in agreement with the YCC conventions and recent updates , . *Paragroups: Y chromosomes not defined by any phylogenetic downstream-reported and -examined mutation.
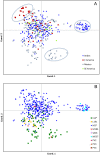
Figure 2. PCoA plots.
Analyses were performed on 433 Native American haplogroup Q Y chromosomes and based on pairwise, individual-by-individual genetic distances generated from 33 loci Y-STR haplotypes (Table S2) represented in their (A) geographic (
Andes
: Bolivia, Chile, Colombia, Ecuador, Peru;
C
entral
America
: Costa Rica, El Salvador, Guatemala, Nicaragua, Panama;
S
outh
E
ast
America
: Argentina, Brazil, Paraguay, Uruguay) and (B) sub-haplogroup Q contexts. Ancient DNA (aDNA) matching haplotypes are indicated by arrows. Three separated (Central American, Mexican and Andean) clusters are indicated by ovals.
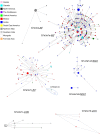
Figure 3. Network of 7 loci Y-STR haplotypes belonging to Q sub-haplogroups.
Network analysis were performed on Native American [Alaskan, Canadian, North American, Caribbean , Central American (from Costa Rica, El Salvador, Guatemala, Nicaragua, Panama), Mexican, Andean (from Bolivia, Chile, Colombia, Ecuador, Peru), South Eastern American (from Argentina, Brazil, Paraguay, Uruguay) (present study)] and Asian [Northern and Southern Altaians , Mongolian and Far Eastern Asian (from Kamchatka, Chukotka and Sea of Okhotsk coast) , ; present study)] samples (Table S4). Light blue loop is referred to the unusual DYS391-6 repeat allele. Arrows indicate the 7 loci haplotypes matching aDNA . Within the single network, circles and colored sectors are proportional to the number of subjects, with the smallest circle equal to one Y chromosome; connecting lines are proportional to the number of mutations.
Similar articles
- The dual origin and Siberian affinities of Native American Y chromosomes.
Lell JT, Sukernik RI, Starikovskaya YB, Su B, Jin L, Schurr TG, Underhill PA, Wallace DC. Lell JT, et al. Am J Hum Genet. 2002 Jan;70(1):192-206. doi: 10.1086/338457. Epub 2001 Nov 30. Am J Hum Genet. 2002. PMID: 11731934 Free PMC article. - Mitochondrial DNA and Y chromosome diversity and the peopling of the Americas: evolutionary and demographic evidence.
Schurr TG, Sherry ST. Schurr TG, et al. Am J Hum Biol. 2004 Jul-Aug;16(4):420-39. doi: 10.1002/ajhb.20041. Am J Hum Biol. 2004. PMID: 15214060 - Y-chromosome evidence for differing ancient demographic histories in the Americas.
Bortolini MC, Salzano FM, Thomas MG, Stuart S, Nasanen SP, Bau CH, Hutz MH, Layrisse Z, Petzl-Erler ML, Tsuneto LT, Hill K, Hurtado AM, Castro-de-Guerra D, Torres MM, Groot H, Michalski R, Nymadawa P, Bedoya G, Bradman N, Labuda D, Ruiz-Linares A. Bortolini MC, et al. Am J Hum Genet. 2003 Sep;73(3):524-39. doi: 10.1086/377588. Epub 2003 Jul 28. Am J Hum Genet. 2003. PMID: 12900798 Free PMC article. - The late Pleistocene dispersal of modern humans in the Americas.
Goebel T, Waters MR, O'Rourke DH. Goebel T, et al. Science. 2008 Mar 14;319(5869):1497-502. doi: 10.1126/science.1153569. Science. 2008. PMID: 18339930 Review. - Genetic variation in the New World: ancient teeth, bone, and tissue as sources of DNA.
Merriwether DA, Rothhammer F, Ferrell RE. Merriwether DA, et al. Experientia. 1994 Jun 15;50(6):592-601. doi: 10.1007/BF01921730. Experientia. 1994. PMID: 8020620 Review.
Cited by
- New Y-SNPs in QM3 indigenous populations of Colombia.
Espitia Fajardo M, Rivera Franco N, Braga Y, Barreto G. Espitia Fajardo M, et al. PLoS One. 2023 Dec 6;18(12):e0294516. doi: 10.1371/journal.pone.0294516. eCollection 2023. PLoS One. 2023. PMID: 38055663 Free PMC article. - Populations dynamics in Northern Eurasian forests: a long-term perspective from Northeast Asia.
Uchiyama J, Gillam JC, Savelyev A, Ning C. Uchiyama J, et al. Evol Hum Sci. 2020 May 21;2:e16. doi: 10.1017/ehs.2020.11. eCollection 2020. Evol Hum Sci. 2020. PMID: 37588381 Free PMC article. - Tierra Del Fuego: What Is Left from the Precolonial Male Lineages?
Rodrigues P, Velázquez IF, Ribeiro J, Simão F, Amorim A, Carvalho EF, Bravi CM, Basso NG, Real LE, Galli C, González ADC, Gamulin A, Saldutti R, Parolin ML, Gomes V, Gusmão L. Rodrigues P, et al. Genes (Basel). 2022 Sep 23;13(10):1712. doi: 10.3390/genes13101712. Genes (Basel). 2022. PMID: 36292597 Free PMC article. - Human Y chromosome sequences from Q Haplogroup reveal a South American settlement pre-18,000 years ago and a profound genomic impact during the Younger Dryas.
Paz Sepúlveda PB, Mayordomo AC, Sala C, Sosa EJ, Zaiat JJ, Cuello M, Schwab M, Rodríguez Golpe D, Aquilano E, Santos MR, Dipierri JE, Alfaro Gómez EL, Bravi CM, Muzzio M, Bailliet G. Paz Sepúlveda PB, et al. PLoS One. 2022 Aug 17;17(8):e0271971. doi: 10.1371/journal.pone.0271971. eCollection 2022. PLoS One. 2022. PMID: 35976870 Free PMC article. - Overview of the Americas' First Peopling from a Patrilineal Perspective: New Evidence from the Southern Continent.
Colombo G, Traverso L, Mazzocchi L, Grugni V, Rambaldi Migliore N, Capodiferro MR, Lombardo G, Flores R, Karmin M, Rootsi S, Ferretti L, Olivieri A, Torroni A, Martiniano R, Achilli A, Raveane A, Semino O. Colombo G, et al. Genes (Basel). 2022 Jan 25;13(2):220. doi: 10.3390/genes13020220. Genes (Basel). 2022. PMID: 35205264 Free PMC article.
References
- O'Rourke DH, Raff JA (2010) The human genetic history of the Americas: the final frontier. Curr Biol 20: R202–207. - PubMed
Publication types
MeSH terms
Substances
Grants and funding
This research received support from the Sorenson Molecular Genealogy Foundation (to UAP, NM, JEG-P and SRW), the Italian Ministry of the University: Progetti di Ricerca Interesse Nazionale 2009 and 2012 (to AA, AT and OS) and FIRB-Futuro in Ricerca (to AA). The funders had no role in study design, data collection and analysis, decision to publish, or preparation of the manuscript.
LinkOut - more resources
Full Text Sources
Other Literature Sources


