Quantitative classification of eyes with and without intermediate age-related macular degeneration using optical coherence tomography - PubMed (original) (raw)
Quantitative classification of eyes with and without intermediate age-related macular degeneration using optical coherence tomography
Sina Farsiu et al. Ophthalmology. 2014 Jan.
Abstract
Objective: To define quantitative indicators for the presence of intermediate age-related macular degeneration (AMD) via spectral-domain optical coherence tomography (SD-OCT) imaging of older adults.
Design: Evaluation of diagnostic test and technology.
Participants and controls: One eye from 115 elderly subjects without AMD and 269 subjects with intermediate AMD from the Age-Related Eye Disease Study 2 (AREDS2) Ancillary SD-OCT Study.
Methods: We semiautomatically delineated the retinal pigment epithelium (RPE) and RPE drusen complex (RPEDC, the axial distance from the apex of the drusen and RPE layer to Bruch's membrane) and total retina (TR, the axial distance between the inner limiting and Bruch's membranes) boundaries. We registered and averaged the thickness maps from control subjects to generate a map of "normal" non-AMD thickness. We considered RPEDC thicknesses larger or smaller than 3 standard deviations from the mean as abnormal, indicating drusen or geographic atrophy (GA), respectively. We measured TR volumes, RPEDC volumes, and abnormal RPEDC thickening and thinning volumes for each subject. By using different combinations of these 4 disease indicators, we designed 5 automated classifiers for the presence of AMD on the basis of the generalized linear model regression framework. We trained and evaluated the performance of these classifiers using the leave-one-out method.
Main outcome measures: The range and topographic distribution of the RPEDC and TR thicknesses in a 5-mm diameter cylinder centered at the fovea.
Results: The most efficient method for separating AMD and control eyes required all 4 disease indicators. The area under the curve (AUC) of the receiver operating characteristic (ROC) for this classifier was >0.99. Overall neurosensory retinal thickening in eyes with AMD versus control eyes in our study contrasts with previous smaller studies.
Conclusions: We identified and validated efficient biometrics to distinguish AMD from normal eyes by analyzing the topographic distribution of normal and abnormal RPEDC thicknesses across a large atlas of eyes. We created an online atlas to share the 38 400 SD-OCT images in this study, their corresponding segmentations, and quantitative measurements.
Copyright © 2014 American Academy of Ophthalmology. Published by Elsevier Inc. All rights reserved.
Figures
Figure 1
Definition of the target segmented layers and layer boundaries. A, Magnified foveal spectral-domain optical coherence tomography (SD-OCT) image with 6.70 μm lateral resolution and 3.24 μm axial resolution. B, Delineation of the target layer boundaries: the inner aspect of the inner limiting membrane (ILM) in blue, the inner aspect of the retinal pigment epithelium drusen complex (RPEDC) in green, and the outer aspect of Bruch's membrane in yellow. A and B, These boundaries isolate the total retina (TR) (orange arrow from blue to yellow), neurosensory retinal (NSR) (purple arrow from blue to green), and RPEDC (red arrow from green to yellow).
Figure 2
Example total retina (TR) and retinal pigment epithelium drusen complex (RPEDC) thickness maps created from control and non-neovascular age-related macular degeneration (AMD) eyes. A, TR map of a control subject centered at the fovea. The location of the foveal spectral-domain optical coherence tomography (SD-OCT) scan is annotated by the purple line. B, TR map of a subjects with AMD annotated with the superior, nasal, inferior, and temporal directions. All thickness maps in this article have this same orientation. C, TR of another subject with AMD. D and E, Foveal scans of the maps in (A–C), respectively. G, RPEDC thickness map of the normal subject in (A). H, RPEDC thickness map of the subject with AMD in (B). Thickening around the fovea (red regions) is indicative of drusen. I, RPEDC thickness map of the subject with AMD in (C). Thickening around the fovea (yellow regions) is representative of drusen, whereas thinning (blue regions) is representative of geographic atrophy (GA).
Figure 3
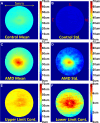
Statistical analysis of retinal pigment epithelium drusen complex (RPEDC) thickness maps centered at the fovea. A, Mean RPEDC thickness map for 115 control subjects. B, Standard deviation RPEDC thickness map for 115 control subjects. C, Mean RPEDC thickness map for 269 subjects with age-related macular degeneration (AMD). D, Standard deviation RPEDC thickness map for 269 subjects with AMD. E, Upper-limit RPEDC thickness map (Fig 4A + 3 × Fig 4B) for control subjects (i.e., within 3 standard deviations) used to detect drusenoid regions. F, Lower-limit RPEDC thickness map (Fig 4A – 3 × Fig 4B) for control subjects (within 3 standard deviations of) used to detect geographic atrophy (GA) regions. N = nasal; S = superior; T = temporal.
Figure 5
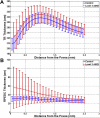
Average retinal pigment epithelium drusen complex (RPEDC) (A) and total retina (TR) (B) thicknesses as a function of the distance from the fovea for control subjects (blue) and subjects with intermediate age-related macular degeneration (AMD) (red). The error bars represent 1 standard deviation. The differences in TR and RPEDC thicknesses in control and intermediate AMD eyes were statistically significant for all measurement points.
Figure 7
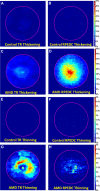
Probability maps for abnormal total retina (TR) and retinal pigment epithelium drusen complex (RPEDC) thickening (A–D) and abnormal TR and RPEDC thinning (E–H) in age-related macular degeneration (AMD) and normal eyes. For example, a probability of 1% in (B) suggests that 0.01×115≈1 control eye has an abnormally thick RPEDC, whereas a probability of 22% in (D) suggests that 0.22×269≈59 AMD eyes have an abnormally thick RPEDC.
Figure 8
Mean neurosensory retinal (NSR) thickness maps for (A) 115 control subjects and (B) 269 subjects with age-related macular degeneration (AMD). The maps are centered at the fovea and 5 mm in diameter. C, Thickness map showing the mean AMD NSR map (B) subtracted by the mean control NSR map (A). The NSR is significantly thicker in AMD versus control eyes at distances >1 mm from the fovea. D, Average NSR thicknesses as a function of the distance from the fovea for control subjects (blue) and subjects with intermediate AMD (red). Error bars represent 1 standard deviation. In contrast to previous reports, the differences in NSR thicknesses in control and intermediate AMD eyes were only statistically significant (Wilcoxon rank-sum test, P < 0.05) for measurement points beyond 0.175 mm from the fovea.
Figure 9
Distinguishing age-related macular degeneration (AMD) from control eyes using 5 different imaging biomarkers. A, Variation of the area under the curve (AUC) of receiver operating characteristic (ROC) per radius of analysis centered at the fovea for each method. B, The ROC curve at the best radius from (A) for each method. Method 1: the total retina (TR) volume (black dashed-dotted curve, AUC = 0.6843), method 2: the retinal pigment epithelium drusen complex (RPEDC) volume (cyan solid curve, AUC = 0.7801), method 3: abnormal RPEDC thickness score (dashed-dotted blue curve, AUC = 0.9856), method 4: abnormal RPEDC thickness and thinness scores (red dotted curve, AUC = 0.9861), and method 5: all 4 markers, including the TR and RPEDC volumes plus the abnormal RPEDC thickening and thinning scores (solid green curve, AUC = 0.9917).
Similar articles
- Drusen Volume and Retinal Pigment Epithelium Abnormal Thinning Volume Predict 2-Year Progression of Age-Related Macular Degeneration.
Folgar FA, Yuan EL, Sevilla MB, Chiu SJ, Farsiu S, Chew EY, Toth CA; Age Related Eye Disease Study 2 Ancillary Spectral-Domain Optical Coherence Tomography Study Group. Folgar FA, et al. Ophthalmology. 2016 Jan;123(1):39-50.e1. doi: 10.1016/j.ophtha.2015.09.016. Epub 2015 Nov 12. Ophthalmology. 2016. PMID: 26578448 - Validated automatic segmentation of AMD pathology including drusen and geographic atrophy in SD-OCT images.
Chiu SJ, Izatt JA, O'Connell RV, Winter KP, Toth CA, Farsiu S. Chiu SJ, et al. Invest Ophthalmol Vis Sci. 2012 Jan 5;53(1):53-61. doi: 10.1167/iovs.11-7640. Invest Ophthalmol Vis Sci. 2012. PMID: 22039246 - Photoreceptor layer thinning over drusen in eyes with age-related macular degeneration imaged in vivo with spectral-domain optical coherence tomography.
Schuman SG, Koreishi AF, Farsiu S, Jung SH, Izatt JA, Toth CA. Schuman SG, et al. Ophthalmology. 2009 Mar;116(3):488-496.e2. doi: 10.1016/j.ophtha.2008.10.006. Epub 2009 Jan 22. Ophthalmology. 2009. PMID: 19167082 Free PMC article. - Drusen in age-related macular degeneration: pathogenesis, natural course, and laser photocoagulation-induced regression.
Abdelsalam A, Del Priore L, Zarbin MA. Abdelsalam A, et al. Surv Ophthalmol. 1999 Jul-Aug;44(1):1-29. doi: 10.1016/s0039-6257(99)00072-7. Surv Ophthalmol. 1999. PMID: 10466585 Review.
Cited by
- 3-D compressed sensing optical coherence tomography using predictive coding.
McLean JP, Hendon CP. McLean JP, et al. Biomed Opt Express. 2021 Mar 31;12(4):2531-2549. doi: 10.1364/BOE.421848. eCollection 2021 Apr 1. Biomed Opt Express. 2021. PMID: 33996246 Free PMC article. - The Project MACULA Retinal Pigment Epithelium Grading System for Histology and Optical Coherence Tomography in Age-Related Macular Degeneration.
Zanzottera EC, Messinger JD, Ach T, Smith RT, Freund KB, Curcio CA. Zanzottera EC, et al. Invest Ophthalmol Vis Sci. 2015 May;56(5):3253-68. doi: 10.1167/iovs.15-16431. Invest Ophthalmol Vis Sci. 2015. PMID: 25813989 Free PMC article. - Understanding the variability of handheld spectral-domain optical coherence tomography measurements in supine infants.
Wang KL, Chen X, Stinnett S, Tai V, Winter KP, Tran-Viet D, Toth CA. Wang KL, et al. PLoS One. 2019 Dec 11;14(12):e0225960. doi: 10.1371/journal.pone.0225960. eCollection 2019. PLoS One. 2019. PMID: 31825990 Free PMC article. - Comparative analysis of alignment algorithms for macular optical coherence tomography imaging.
Jones CK, Li B, Wu JH, Nakaguchi T, Xuan P, Liu TYA. Jones CK, et al. Int J Retina Vitreous. 2023 Oct 2;9(1):60. doi: 10.1186/s40942-023-00497-2. Int J Retina Vitreous. 2023. PMID: 37784169 Free PMC article. - Retinal optical coherence tomography image enhancement via deep learning.
Halupka KJ, Antony BJ, Lee MH, Lucy KA, Rai RS, Ishikawa H, Wollstein G, Schuman JS, Garnavi R. Halupka KJ, et al. Biomed Opt Express. 2018 Nov 13;9(12):6205-6221. doi: 10.1364/BOE.9.006205. eCollection 2018 Dec 1. Biomed Opt Express. 2018. PMID: 31065423 Free PMC article.
References
- Bressler NM. Age-related macular degeneration is the leading cause of blindness. JAMA. 2004;291:1900–1. - PubMed
Publication types
MeSH terms
LinkOut - more resources
Full Text Sources
Other Literature Sources
Medical
Miscellaneous


