Cerebral organoids model human brain development and microcephaly - PubMed (original) (raw)
. 2013 Sep 19;501(7467):373-9.
doi: 10.1038/nature12517. Epub 2013 Aug 28.
Affiliations
- PMID: 23995685
- PMCID: PMC3817409
- DOI: 10.1038/nature12517
Cerebral organoids model human brain development and microcephaly
Madeline A Lancaster et al. Nature. 2013.
Abstract
The complexity of the human brain has made it difficult to study many brain disorders in model organisms, highlighting the need for an in vitro model of human brain development. Here we have developed a human pluripotent stem cell-derived three-dimensional organoid culture system, termed cerebral organoids, that develop various discrete, although interdependent, brain regions. These include a cerebral cortex containing progenitor populations that organize and produce mature cortical neuron subtypes. Furthermore, cerebral organoids are shown to recapitulate features of human cortical development, namely characteristic progenitor zone organization with abundant outer radial glial stem cells. Finally, we use RNA interference and patient-specific induced pluripotent stem cells to model microcephaly, a disorder that has been difficult to recapitulate in mice. We demonstrate premature neuronal differentiation in patient organoids, a defect that could help to explain the disease phenotype. Together, these data show that three-dimensional organoids can recapitulate development and disease even in this most complex human tissue.
Figures
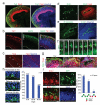
Figure 1. Description of cerebral organoid culture system
a, Schematic of the culture system described in detail in Methods. Example images of each stage are shown. b, Neuroepithelial tissues generated using this approach (left panel) exhibited large fluid-filled cavities and typical apical localization of the neural N-cadherin (arrow). These tissues were larger and more continuous than tissues grown in stationary suspension without Matrigel (right panel). c, Sectioning and immunohistochemistry revealed complex morphology with heterogeneous regions containing neural progenitors (Sox2, red) and neurons (Tuj1, green) (arrow). d, Low magnification bright field images revealing fluid-filled cavities reminiscent of ventricles (white arrow) and retina tissue, as indicated by retinal pigmented epithelium (black arrow). Scale bars: 200 μm.
Figure 2. Human cerebral organoids recapitulate various brain region identities
a, RT-PCR for forebrain markers (BF1 and Six3) and hindbrain markers (Krox20 and Isl1) at 12, 16 and 20 days of differentiation. Human fetal brain cDNA was used as positive control. b, Immunohistochemistry in serial sections for the forebrain marker Pax6 (red, first panel) and the hindbrain markers Krox20 (green, first panel) and Pax2 (red, second panel) at 16 days of differentiation. Note the juxtaposition reminiscent of the mid-hindbrain boundary (arrows). DAPI marks nuclei (blue). c,-i, Staining for various brain region identities: forebrain, FoxG1 (c); dorsal cortex, Emx1 (d); prefrontal cortex (note the discrete boundary, arrow), Auts2 (e); hippocampus, Nrp2, Fzd9, Prox1 (f); ventral forebrain, Nkx2.1 (g) and choroid plexus, TTR (i). g, Staining for adjacent ventral (arrow) and dorsal (Pax6, arrowhead) forebrain and for calretinin (green) in a serial section revealing cortical interneurons in the ventral region (arrow). Calretinin interneurons within dorsal cortex (h) exhibit typical morphology of tangential migration (arrows). j, Hematoxylin-eosin staining of retinal tissue exhibiting stereotypical layering: retinal pigment epithelium (RPE), outer nuclear layer (ONL) and inner nuclear layer (INL). Scale bars: 100 μm.
Figure 3. Stereotypical organization and behavior of progenitors
a, Immunohistochemistry for neurons (Tuj1, green) and RGs (Pax6, red) in a large dorsal cortical region. Note the additional Pax6+ RGs located outside the VZ (arrowheads), reminiscent of oRGs. b, Staining for the preplate marker Tbr1 (red) and neuronal marker MAP2 (green) revealing superficial preplate (upper bracket) and underlying neuronal IZ-like layer (lower bracket). c, Staining for the IP marker Tbr2 (red) revealing SVZ localization of IPs (arrows). d, Staining for phospho-histone H3 (PH3, green) to mark radial glia (Pax6+) in mitosis. Arrows mark apical surface divisions; arrowheads mark SVZ divisions. e, Phospho-Vimentin (green) staining for mitotic radial glia which primarily divide at the apical surface (arrows). f, Frames from live imaging of GFP electroporated radial glia showing cell body movement (arrow). Time shown in hrs:min. g, BrdU pulse-chase revealing progressive IKNM of BrdU labeled nuclei (green, arrowheads) from basal VZ (1hr) to more apical position (4-6hr). h, Quantification of radial glial division orientation displayed in bins of 0-30 (horizontal), 30-60 (oblique) and 60-90 degrees (vertical). n=27 anaphase cells from 5 cerebral cortical tissues. i. Lineage tracing in GFP electroporated and BrdU pulsed tissues to mark daughter cell pairs following 16-hr chase revealing symmetric (arrowheads) and asymmetric (arrows) fates indicated by Sox2 staining (blue). Quantification for 18 cell pairs from three cortical tissues. Numbers above bars are absolute cell numbers. Dashed line indicates apical surface (b, c, g, i). Scale bars: 100 μm (a-e,g), 10 μm (f, h), 20 μm (i).
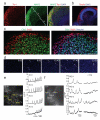
Figure 4. Organization and maturation of cerebral cortical neurons
a, Immunohistochemical staining at day 30 showing preplate (Tbr1) with early signs of radial organization (MAP2, bracket i) and the presence of an IZ-like layer (bracket ii) adjacent to the VZ/SVZ (bracket iii). DAPI marks nuclei (blue). b, Reelin staining indicating Cajal-Retzius cells along the basal surface of dorsal cortical tissue. c, Staining for early born (Ctip2) and late born (Satb2) neurons at 75 days differentiation reveals separation and rudimentary inside-out organization. d. False color heat map frames from Fluo-4 calcium live imaging revealing spontaneous calcium surges (arrowheads). Time is displayed in min:sec. e. Single cell tracings of calcium surges with glutamate application (regions of interest, ROI, outlined in left panel) as measured by change in fluorescence (arbitrary units). Arrows mark the time of addition of glutamate. f. Single cell tracing (ROIs marked in image at left) of calcium surges before (left panels) and after the addition of TTX (right panels). Scale bars: 100 μm.
Figure 5. Cerebral organoids produce oRGs with typical morphology and behavior
a. Immunohistochemical staining for RGs (Sox2) and neuronal processes (Tuj1) reveals the presence of oRGs (arrowheads) organized similar to human cortical development (OSVZ-like layer, ** bracket) separated from the VZ by a layer of Tuj1+ fibers similar to IFL (* bracket). b. Staining for phospho-Vimentin revealing dividing oRGs (arrows) with typical morphology: possessing a basal process (arrowheads) but lacking an apical process. Right panel: a daughter cell pair showing unequal inheritance of the basal process. Apical-basal orientation indicated by “A→B”. c. Staining for phospho-Vimentin (P-Vim) in a recently divided daughter cell pair with asymmetric fates: one oRG (arrow, Sox2+) while the other lacks Sox2 expression (arrowhead). d. Orientation of division of a mitotic oRG in anaphase revealing vertical (60-90 degrees) orientation relative to the apical surface (dashed line). Quantification of spindle orientation for 14 anaphase oRGs from 6 different cortical tissues. Scale bars: 50 μm (a), 20 μm (b-d).
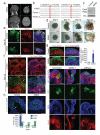
Figure 6. Cerebral organoid modeling of microcephaly
a. MRI scan from patient A3842 taken at birth (top) compared with age-matched control (bottom) showing brain and head size reduction and simplified cortical folding (arrows). Saggital T1 (left) and axial T2 (right) images. Scale bar 1cm. b. Sequencing chromatograms demonstrating compound heterozygous nonsense mutations inherited from each parent. c. CDK5RAP2 protein is undetectable on immunoblotting of patient cell lysate (A3842) compared with control skin fibroblasts. Vinculin (VCL), loading control. d. Representative bright-field images of control and patient-derived cerebral organoids (A3842 line 1M, all lines shown in Extended Data Figure 7d) at 6, 11, 15, and 22 days of differentiation. Control exhibits large fluid-filled cortical regions (arrows), while patient-derived exhibits increased outgrowth (arrowheads). e. Immunohistochemistry in control and patient-derived (10M) tissues at day 30 of differentiation revealing fewer neurons (Doublecortin, DCX, arrows) and smaller progenitor zones (Sox2, arrowheads). f. Staining at day 22 showing increased neurons (Tuj1, arrows) in patient-derived tissue (14B). g. BrdU pulse-chase in control and patient-derived organoids (14B) showing higher percentage of BrdU+ cells with neural identity and less in the VZ compared with control. Results quantified at right. Error bars are S.D. **P<0.01, Student’s _t_-test. n=3 organoids for each condition (300 cells total for control, 204 cells for patient). **h.** P-Vimentin staining in control and patient-derived tissues (14B) showing RG mitotic divisions. Control RGs at anaphase divided exclusively horizontal (0-30 degree angle, arrow) whereas patient RGs displayed many oblique and vertical orientations (arrowhead). Results quantified at right (_P_<0.01, 2×3 Fisher’s exact test, n=11 cells for control, n=15 cells for patient-derived, from >5 cortical regions each). i. hESC organoids co-electroporated with GFP and scrambled or CDK5RAP2 shRNAs and examined after 5 days. Electroporated regions (demarcated by arrowheads) exhibit loss of Sox2+ progenitors and increased Doublecortin (DCX) neurons. Scale bars: 200 μm (d, e, i), 50 μm (f-h).
Comment in
- Developmental neuroscience: Miniature human brains.
Brüstle O. Brüstle O. Nature. 2013 Sep 19;501(7467):319-20. doi: 10.1038/nature12552. Epub 2013 Aug 28. Nature. 2013. PMID: 23995687 No abstract available. - Stem cells: Small but beautiful.
Welberg L. Welberg L. Nat Rev Neurosci. 2013 Oct;14(10):665. doi: 10.1038/nrn3600. Epub 2013 Sep 12. Nat Rev Neurosci. 2013. PMID: 24026116 No abstract available. - Cerebral organoids in a dish: progress and prospects.
Bershteyn M, Kriegstein AR. Bershteyn M, et al. Cell. 2013 Sep 26;155(1):19-20. doi: 10.1016/j.cell.2013.09.010. Cell. 2013. PMID: 24074857 Free PMC article. - Build-a-brain.
Chambers SM, Tchieu J, Studer L. Chambers SM, et al. Cell Stem Cell. 2013 Oct 3;13(4):377-8. doi: 10.1016/j.stem.2013.09.010. Cell Stem Cell. 2013. PMID: 24094317 - Neuroscience. What are mini-brains?
Bae BI, Walsh CA. Bae BI, et al. Science. 2013 Oct 11;342(6155):200-1. doi: 10.1126/science.1245812. Science. 2013. PMID: 24115427 No abstract available. - Stem cells: The developing human brain--modeled in a dish.
Pastrana E. Pastrana E. Nat Methods. 2013 Oct;10(10):929. doi: 10.1038/nmeth.2674. Nat Methods. 2013. PMID: 24161970 No abstract available. - Modeling human brain development with cerebral organoids.
Muzio L, Consalez GG. Muzio L, et al. Stem Cell Res Ther. 2013;4(6):154. doi: 10.1186/scrt384. Stem Cell Res Ther. 2013. PMID: 24367992 Free PMC article. - Cerebral organoids model human brain development and microcephaly.
Hattori N. Hattori N. Mov Disord. 2014 Feb;29(2):185. doi: 10.1002/mds.25740. Epub 2013 Dec 27. Mov Disord. 2014. PMID: 24375826 No abstract available. - Building brains: using brain organoids to study neural development and disease.
Lyon L. Lyon L. Brain. 2019 Nov 1;142(11):e65. doi: 10.1093/brain/awz308. Brain. 2019. PMID: 31591637 No abstract available.
Similar articles
- Modeling human brain development with cerebral organoids.
Muzio L, Consalez GG. Muzio L, et al. Stem Cell Res Ther. 2013;4(6):154. doi: 10.1186/scrt384. Stem Cell Res Ther. 2013. PMID: 24367992 Free PMC article. - Cerebral organoids in a dish: progress and prospects.
Bershteyn M, Kriegstein AR. Bershteyn M, et al. Cell. 2013 Sep 26;155(1):19-20. doi: 10.1016/j.cell.2013.09.010. Cell. 2013. PMID: 24074857 Free PMC article. - Build-a-brain.
Chambers SM, Tchieu J, Studer L. Chambers SM, et al. Cell Stem Cell. 2013 Oct 3;13(4):377-8. doi: 10.1016/j.stem.2013.09.010. Cell Stem Cell. 2013. PMID: 24094317 - Brain Organoids: Expanding Our Understanding of Human Development and Disease.
Chuye LB, Dimitri A, Desai A, Handelmann C, Bae Y, Johari P, Jornet JM, Klejbor I, Stachowiak MK, Stachowiak EK. Chuye LB, et al. Results Probl Cell Differ. 2018;66:183-206. doi: 10.1007/978-3-319-93485-3_8. Results Probl Cell Differ. 2018. PMID: 30209660 Review. - The Emergence of Stem Cell-Based Brain Organoids: Trends and Challenges.
Gopalakrishnan J. Gopalakrishnan J. Bioessays. 2019 Aug;41(8):e1900011. doi: 10.1002/bies.201900011. Epub 2019 Jul 5. Bioessays. 2019. PMID: 31274205 Review.
Cited by
- Bioengineering the human spinal cord.
Iyer NR, Ashton RS. Iyer NR, et al. Front Cell Dev Biol. 2022 Aug 26;10:942742. doi: 10.3389/fcell.2022.942742. eCollection 2022. Front Cell Dev Biol. 2022. PMID: 36092702 Free PMC article. Review. - Protein bio-corona: critical issue in immune nanotoxicology.
Neagu M, Piperigkou Z, Karamanou K, Engin AB, Docea AO, Constantin C, Negrei C, Nikitovic D, Tsatsakis A. Neagu M, et al. Arch Toxicol. 2017 Mar;91(3):1031-1048. doi: 10.1007/s00204-016-1797-5. Epub 2016 Jul 20. Arch Toxicol. 2017. PMID: 27438349 Free PMC article. Review. - Biomaterial-based in vitro 3D modeling of glioblastoma multiforme.
Ahmed T. Ahmed T. Cancer Pathog Ther. 2023 Jan 9;1(3):177-194. doi: 10.1016/j.cpt.2023.01.002. eCollection 2023 Jul. Cancer Pathog Ther. 2023. PMID: 38327839 Free PMC article. Review. - Transparent, Compliant 3D Mesostructures for Precise Evaluation of Mechanical Characteristics of Organoids.
Ryu H, Park Y, Luan H, Dalgin G, Jeffris K, Yoon HJ, Chung TS, Kim JU, Kwak SS, Lee G, Jeong H, Kim J, Bai W, Kim J, Jung YH, Tryba AK, Song JW, Huang Y, Philipson LH, Finan JD, Rogers JA. Ryu H, et al. Adv Mater. 2021 Jun;33(25):e2100026. doi: 10.1002/adma.202100026. Epub 2021 May 13. Adv Mater. 2021. PMID: 33984170 Free PMC article. - Tools for studying human microglia: In vitro and in vivo strategies.
Warden AS, Han C, Hansen E, Trescott S, Nguyen C, Kim R, Schafer D, Johnson A, Wright M, Ramirez G, Lopez-Sanchez M, Coufal NG. Warden AS, et al. Brain Behav Immun. 2023 Jan;107:369-382. doi: 10.1016/j.bbi.2022.10.008. Epub 2022 Nov 3. Brain Behav Immun. 2023. PMID: 36336207 Free PMC article. Review.
References
- Götz M, Huttner WB. The cell biology of neurogenesis. Nat Rev Mol Cell Biol. 2005;6:777–788. - PubMed
- Fietz SA, et al. OSVZ progenitors of human and ferret neocortex are epithelial-like and expand by integrin signaling. Nat Neurosci. 2010;13:690–699. - PubMed
- Hansen DV, Lui JH, Parker PRL, Kriegstein AR. Neurogenic radial glia in the outer subventricular zone of human neocortex. Nature. 2010;464:554–561. - PubMed
Publication types
MeSH terms
Grants and funding
- Z 153/FWF_/Austrian Science Fund FWF/Austria
- I 552/FWF_/Austrian Science Fund FWF/Austria
- 250342/ERC_/European Research Council/International
- MC_PC_U127580972/MRC_/Medical Research Council/United Kingdom
- WT_/Wellcome Trust/United Kingdom
- WT098051/WT_/Wellcome Trust/United Kingdom
LinkOut - more resources
Full Text Sources
Other Literature Sources
Research Materials


