Control of synaptic vesicle endocytosis by an extracellular signalling molecule - PubMed (original) (raw)
Control of synaptic vesicle endocytosis by an extracellular signalling molecule
Karen J Smillie et al. Nat Commun. 2013.
Free PMC article
Abstract
Signalling cascades control multiple aspects of presynaptic function. Synaptic vesicle endocytosis was assumed to be exempt from modulation, due to its essential role maintaining synaptic vesicle supply and thus neurotransmission. Here we show that brain-derived neurotrophic factor arrests the rephosphorylation of the endocytosis enzyme dynamin I via an inhibition of glycogen synthase kinase 3. This event results in a selective inhibition of activity-dependent bulk endocytosis during high-intensity firing. Furthermore, the continued presence of brain-derived neurotrophic factor alleviates the rundown of neurotransmission during high activity. Thus, synaptic strength can be modulated by extracellular signalling molecules via a direct inhibition of a synaptic vesicle endocytosis mode.
Figures
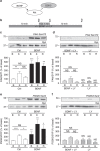
Figure 1. BDNF inhibits GSK3 activity via a PI3K-dependent cascade.
(a) Scheme illustrating that BDNF would activate a signalling cascade, which would phosphorylate and inactivate GSK3. (b) CGNs were placed in incubation medium for 10 min before stimulation with 50 mM KCl (1 min). Following stimulation CGNs were repolarized for 10 min. Samples were prepared from cultures before stimulation (basal, B), directly after KCl stimulation (K) or after 10 min repolarization (R) as indicated by arrowheads. BDNF (100 ng ml−1) or LY294002 (LY, 10 μM) were present throughout the experiment where indicated. Lysates were separated by SDS–PAGE and probed for either (c,d) phospho-Ser-473 on Akt (PAkt Ser473) or (e,f) phospho-Ser-9 on GSK3 (PGSK3 Ser-9) on immunoblots. Quantitative analysis is shown in the graphs in (c–f). These graphs display the extent of phosphorylation of either Ser-473 on Akt (c,d) or Ser-9 on GSK3 (e,f). All values were normalized to the amount of synaptophysin (SYP) as a loading control, and expressed as a percentage of Basal control±s.e.m. (c) _n_=7, (d) _n_=6, (e) _n_=7, (f) _n_=6; one-way ANOVA. *P<0.05, **P<0.01, ***P<0.001 compared with basal control unless indicated.
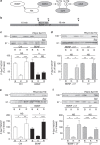
Figure 2. BDNF inhibits dynamin I rephosphorylation on Ser-774 via a PI3K-dependent cascade.
(a) Scheme illustrating that cdk5 phosphorylates Ser-778 on dynamin I (DynI), allowing GSK3 to phosphorylate Ser-774. Our hypothesis was that BDNF would activate Akt to phosphorylate and inactivate GSK3, thus inhibiting its ability to rephosphorylate Ser-774 on DynI. (b) CGNs were placed in incubation medium for 10 min before stimulation with 50 mM KCl (1 min). Following stimulation, CGNs were repolarized for 10 min. Samples were prepared from cultures before stimulation (basal, B), directly after KCl stimulation (K) or after 10 min repolarization (R) as indicated by arrowheads. BDNF (100 ng ml−1) or LY294002 (LY, 10 μM) were present throughout the experiment where indicated. Lysates were separated by SDS–PAGE and probed for either (c,d) phospho-Ser-774 (PDynI Ser-774) or (e,f) phospho-Ser-778 (PDynI Ser-778) on dynamin I on immunoblots. Quantitative analysis is shown in the graphs in (c–f). These graphs display the extent of phosphorylation of either Ser-774 (c,d) or Ser-778 (e,f). All values were normalized to the amount of synaptophysin (SYP) as a loading control, and expressed as a percentage of Basal±s.e.m. (c) _n_=9, (d) _n_=3, (e) _n_=5, (f) _n_=4, one-way analysis of variance (ANOVA). *P<0.05, **P<0.01, ***P<0.001.
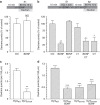
Figure 3. BDNF inhibition of protein rephosphorylation by GSK3 arrests dextran uptake.
(a) CGNs or (c) CGNs transfected with either wild-type (DynIWT) or S774A dynamin I mutant (DynIS774A) were placed in incubation medium for 10 min before stimulation with a train of 800 action potentials (80 Hz) in the presence of 50 μM tetramethylrhodamine dextran. (b) CGNs or (d) CGNs transfected with either wild-type (DynIWT) or S774A dynamin I mutant (DynIS774A) were placed in incubation medium for 10 min before a priming stimulus of 50 mM KCl (1 min). CGNs were then repolarized for 10 min before stimulation with 800 action potentials (80 Hz) in the presence of 50 μM tetramethylrhodamine dextran. BDNF (100 ng ml−1), LY294002 (LY, 10 μM) or CT99021 (CT, 2 μM) were present throughout the experiment where indicated. Dextran was perfused away immediately after stimulation in both cases. (a,b) The number of dextran puncta expressed as a percentage of control corrected for the unstimulated background±s.e.m., (a) Ctrl and BDNF _n_=5; Student’s _t_-test _P_=0.69, (b) Ctrl _n_=10, BDNF _n_=4, BDNF/LY _n_=4, LY _n_=7, BDNF/CT _n_=3, CT _n_=3 one-way analysis of variance (ANOVA). *P<0.05, **P<0.01 compared with control. (c,d) The average number of dextran puncta per 100 μm of transfected neuron corrected for unstimulated background ±s.e.m., (c) both _n_=3; Student’s _t_-test _P_=0.006, (d) DynIWT _n_=5, all others _n_=3, one-way ANOVA. ***P<0.001 compared with DynIWT.
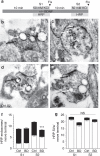
Figure 4. BDNF arrests HRP-endosome formation after prior stimulation.
(a) CGNs were placed in incubation medium for 10 min before stimulation with 50 mM KCl for 2 min (S1). CGNs were then repolarized for 10 min before a second stimulus with 50 mM KCl (S2). HRP (10 mg ml−1) was co-applied with KCl at either S1 or S2 and CGNs were immediately fixed after stimulation as indicated by arrowheads. BDNF (100 ng ml−1) was present the throughout experiment where indicated. Representative images display typical nerve terminals at S1 for either Ctrl (b) or BDNF (c) and at S2 for either Ctrl (d) or BDNF (e). White arrows indicate HRP-labelled endosomes, black arrows indicate HRP-labelled SVs. Scale bar, 150 nm for b–e. Mean number of HRP-labelled (solid bars) or empty (open bars) endosomes (f) or SVs (g) at either S1 or S2 in control (Ctrl) or BDNF-treated (BD) cells ±s.e.m. (_n_=3 independent experiments for all conditions; one-way analysis of variance (ANOVA). ***P<0.001 compared with all other conditions).
Figure 5. BDNF has no effect on SV exocytosis.
CGNs expressing sypHy were placed in incubation medium for 10 min. The sypHy fluorescence response was then monitored for 40 s before addition of bafilomycin A1 (200 nM). After 10 min, CGNs were stimulated with a train of 800 action potentials (80 Hz). Finally, cultures were exposed to 50 mM NH4Cl. (a) Representative traces of the sypHy response in the presence (solid) or absence (clear, Ctrl) of BDNF (100 ng ml−1) are displayed showing the response to bafilomycin A1, action potentials and NH4Cl (indicated by bars). Traces are normalized to the NH4Cl pulse. (b) Quantified data showing the extent of spontaneous (Spon, dark grey) and evoked (80 Hz, light grey) SV exocytosis in the absence (Ctrl) or presence (BDNF) of BDNF. Both values are displayed as a proportion of the total SV pool ±s.e.m., Ctrl, _n_=4, BDNF, _n_=5 independent experiments, Student’s _t_-test _P_=0.17 for spontaneous and _P_=0.45 for evoked.
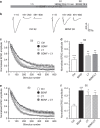
Figure 6. BDNF relieves synaptic depression at cerebellar synapses.
(a) Cerebellar slices were incubated with combinations of either BDNF (100 ng ml−1), LY294002 (LY 10 μM) or CT99021 (2 μM) for 1 h before being transferred to the recording chamber. Slices were challenged with 600 action potentials (40 Hz, S1) then allowed to recover for 10 min before a second challenge with an identical stimulus train. (b) Example mean EPSCs recorded at three time points during the train of 600 stimuli. The numbers above denote the sweep numbers that were averaged to obtain the trace. (c,e) Summary plots showing the dependence of the EPSC amplitude on the stimulus number at S2. The first EPSC was normalized to 1 to allow direct comparison of the different recording conditions on the rundown of the amplitudes of the EPSCs. (d,f) The mean EPSC amplitude after 200 action potentials is displayed for each experimental condition±s.e.m. (Ctrl _n_=11, BDNF _n_=9, LY _n_=7, BDNF/LY _n_=9, CT _n_=9, BDNF/CT _n_=9; one-way analysis of variance (ANOVA) in (e). ***P<0.001, **P<0.01 compared with BDNF; in (f) ***P<0.001, *P<0.05 compared with Ctrl; all other conditions were not significant to each other).
Similar articles
- Dynamin I phosphorylation by GSK3 controls activity-dependent bulk endocytosis of synaptic vesicles.
Clayton EL, Sue N, Smillie KJ, O'Leary T, Bache N, Cheung G, Cole AR, Wyllie DJ, Sutherland C, Robinson PJ, Cousin MA. Clayton EL, et al. Nat Neurosci. 2010 Jul;13(7):845-51. doi: 10.1038/nn.2571. Epub 2010 Jun 6. Nat Neurosci. 2010. PMID: 20526333 Free PMC article. - Akt/PKB controls the activity-dependent bulk endocytosis of synaptic vesicles.
Smillie KJ, Cousin MA. Smillie KJ, et al. Traffic. 2012 Jul;13(7):1004-11. doi: 10.1111/j.1600-0854.2012.01365.x. Epub 2012 Apr 29. Traffic. 2012. PMID: 22487004 Free PMC article. - Syndapin I is the phosphorylation-regulated dynamin I partner in synaptic vesicle endocytosis.
Anggono V, Smillie KJ, Graham ME, Valova VA, Cousin MA, Robinson PJ. Anggono V, et al. Nat Neurosci. 2006 Jun;9(6):752-60. doi: 10.1038/nn1695. Epub 2006 Apr 30. Nat Neurosci. 2006. PMID: 16648848 Free PMC article. - Dynamin I phosphorylation and the control of synaptic vesicle endocytosis.
Smillie KJ, Cousin MA. Smillie KJ, et al. Biochem Soc Symp. 2005;(72):87-97. doi: 10.1042/bss0720087. Biochem Soc Symp. 2005. PMID: 15649133 Free PMC article. Review. - The synaptic vesicle cycle revisited.
Südhof TC. Südhof TC. Neuron. 2000 Nov;28(2):317-20. doi: 10.1016/s0896-6273(00)00109-4. Neuron. 2000. PMID: 11144340 Review. No abstract available.
Cited by
- Small molecules targeting endocytic uptake and recycling pathways.
Placidi G, Mattu C, Ciardelli G, Campa CC. Placidi G, et al. Front Cell Dev Biol. 2023 Mar 10;11:1125801. doi: 10.3389/fcell.2023.1125801. eCollection 2023. Front Cell Dev Biol. 2023. PMID: 36968200 Free PMC article. Review. - The allostatic impact of chronic ethanol on gene expression: A genetic analysis of chronic intermittent ethanol treatment in the BXD cohort.
van der Vaart AD, Wolstenholme JT, Smith ML, Harris GM, Lopez MF, Wolen AR, Becker HC, Williams RW, Miles MF. van der Vaart AD, et al. Alcohol. 2017 Feb;58:93-106. doi: 10.1016/j.alcohol.2016.07.010. Epub 2016 Nov 1. Alcohol. 2017. PMID: 27838001 Free PMC article. - Synaptic Vesicle Recycling Is Unaffected in the Ts65Dn Mouse Model of Down Syndrome.
Marland JR, Smillie KJ, Cousin MA. Marland JR, et al. PLoS One. 2016 Jan 25;11(1):e0147974. doi: 10.1371/journal.pone.0147974. eCollection 2016. PLoS One. 2016. PMID: 26808141 Free PMC article. - FMRP Sustains Presynaptic Function via Control of Activity-Dependent Bulk Endocytosis.
Bonnycastle K, Kind PC, Cousin MA. Bonnycastle K, et al. J Neurosci. 2022 Feb 23;42(8):1618-1628. doi: 10.1523/JNEUROSCI.0852-21.2021. Epub 2022 Jan 7. J Neurosci. 2022. PMID: 34996816 Free PMC article. - The Synaptic Vesicle Cycle Revisited: New Insights into the Modes and Mechanisms.
Chanaday NL, Cousin MA, Milosevic I, Watanabe S, Morgan JR. Chanaday NL, et al. J Neurosci. 2019 Oct 16;39(42):8209-8216. doi: 10.1523/JNEUROSCI.1158-19.2019. J Neurosci. 2019. PMID: 31619489 Free PMC article. Review.
References
- Miller R. J. Presynaptic receptors. Annu. Rev. Pharmacol. Toxicol. 38, 201–227 (1998). - PubMed
- Granseth B., Odermatt B., Royle S. J. & Lagnado L. Clathrin-mediated endocytosis is the dominant mechanism of vesicle retrieval at hippocampal synapses. Neuron 51, 773–786 (2006). - PubMed
Publication types
MeSH terms
Substances
LinkOut - more resources
Full Text Sources
Other Literature Sources
Molecular Biology Databases
