Minimal differentiation of classical monocytes as they survey steady-state tissues and transport antigen to lymph nodes - PubMed (original) (raw)
. 2013 Sep 19;39(3):599-610.
doi: 10.1016/j.immuni.2013.08.007. Epub 2013 Sep 5.
Emmanuel L Gautier, Sophie L Gibbings, Dorothy K Sojka, Andreas Schlitzer, Theodore E Johnson, Stoyan Ivanov, Qiaonan Duan, Shashi Bala, Tracy Condon, Nico van Rooijen, John R Grainger, Yasmine Belkaid, Avi Ma'ayan, David W H Riches, Wayne M Yokoyama, Florent Ginhoux, Peter M Henson, Gwendalyn J Randolph
Affiliations
- PMID: 24012416
- PMCID: PMC3820017
- DOI: 10.1016/j.immuni.2013.08.007
Minimal differentiation of classical monocytes as they survey steady-state tissues and transport antigen to lymph nodes
Claudia Jakubzick et al. Immunity. 2013.
Abstract
It is thought that monocytes rapidly differentiate to macrophages or dendritic cells (DCs) upon leaving blood. Here we have shown that Ly-6C⁺ monocytes constitutively trafficked into skin, lung, and lymph nodes (LNs). Entry was unaffected in gnotobiotic mice. Monocytes in resting lung and LN had similar gene expression profiles to blood monocytes but elevated transcripts of a limited number of genes including cyclo-oxygenase-2 (COX-2) and major histocompatibility complex class II (MHCII), induced by monocyte interaction with endothelium. Parabiosis, bromodoxyuridine (BrdU) pulse-chase analysis, and intranasal instillation of tracers indicated that instead of contributing to resident macrophages in the lung, recruited endogenous monocytes acquired antigen for carriage to draining LNs, a function redundant with DCs though differentiation to DCs did not occur. Thus, monocytes can enter steady-state nonlymphoid organs and recirculate to LNs without differentiation to macrophages or DCs, revising a long-held view that monocytes become tissue-resident macrophages by default.
Copyright © 2013 Elsevier Inc. All rights reserved.
Figures
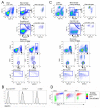
Figure 1. Analysis of tissues for the presence of monocytes
For skin (A) and lung (C), doublet-cell excluded, live cells were plotted as CD11c vs CD11b or MerTK vs CD64. Live cells plotted as MerTK vs CD64 defined tissue macrophages as MerTK+CD64+. Gated MerTK+CD64+ macrophages were CD11c+ and CD11b+ (top panels). Continuing with the remaining MerTK− CD64− gate, DCs were identified as MerTK−CD64−CD11c+MHCII+ (second row panels), with both CD11bhi and CD11blo subsets. Events captured neither in the macrophage or DC gate were then plotted to depict CD64 vs CD11b or CD11c vs CD11b, allowing us to identify monocytes and granulocytes (third row panels). Tissue monocytes were low SSC F480+Ly-6C+MHCII+ (fourth and fifth row panels). B) Blood monocytes were stained with anti-MerTK mAb, but lacked reactivity. Black line, anti-Mertk mAb; gray profile, Isotype control mAb. D) SSC overlay of tissue and LN monocytes, DCs and macrophages from gates shown in A, C. Data are representative of ≥ 3 experiments. Fig. S1 accompanies this figure.
Figure 2. Analysis of blood and tissue monocytes in CX3CR1_gfp_ mice and Lyz2-cre × Rosa26 EGFP reporter mice
A) The gating strategy leading to generation of 5 gates for monocyte subsets is shown using dots plots (left) and a diagram (right). B) The frequency of blood monocyte subsets in gates 1-5 from Panel A are plotted on a log scale. C) GFP intensity of blood monocyte subsets, gates 1-5, from _Cx3cr1_gfp/gfp mice. D) Overlay of GFP intensity in monocytes from blood, lung, skin, and LNs in _Cx3cr1_gfp/gfp mice. Ly-6C+MHCII− (gate 1) and Ly-6C− MHCII− (gate 4) blood monocytes were used to illustrate GFP intensity of these subsets. E) The frequency of GFP+ cells among blood monocyte subsets, gates 1-5, from _Lyz2-crex_RosaGFPflox reporter mice. Each dot represents one mouse from six experiments. F) EGFP+ frequency within indicated populations divided by the frequency of EGFP+ Ly-6C+MHCII+ (gate 2) blood monocytes in the same mouse. Blood Ly-6C−MHCII− monocytes (gate 4) and pDCs were used as controls. LLN, lung-draining LN; SLN, skin-draining LN; MLN, mesenteric LN. All data are derived from 3-6 experiments. Fig. S2 accompanies this figure.
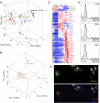
Figure 3. Gene expression analysis comparing tissue and blood monocytes with macrophages and DCs
Principle component analysis (PCA) is a mathematical procedure that depicts uncorrelated variables on each axis. Percentage shown on each axis indicate the percent of variability explained, with the first priniciple component (PC1) defined as that which explains the most variability. The placement of data in proximity indicates a closer relationship between the datasets. A) PCA of LN resident DCs CD8+ and CD4+, migratory LN DCs, Langerhans cells (LC), macrophages (MF), and monocytes (Mo) from LN and blood (BL) (population gates 1-5 from Fig. 2; gate numbers next to Mo symbol). PC, peritoneal cavity; CNS, central nervous system; Sp, spleen; Lu, lung. Each population is depicted with a different color. B) PCA of lung (Lu) alveolar macrophages (CD11b−) and interstitial macrophages (CD11b+), and monocytes from blood, lung, MLN and SLN. Each population is depicted with a different color. C) Heat map depicts genes that are elevated ≥ 3-fold in blood, lung and SLN monocytes. D) Immunostaining for COX-2 expression in Ly6C+ monocytes and DCs of the lung parenchyma. E) Intracellular staining for chemokines, CXCL10 (open black) and CCL5 (open gray), along with isotype control (shaded gray) in the lung, skin and SLN. Fig. S3 and Tables S1 and S2 accompany this figure.
Figure 4. Turnover of tissue monocytes
Frequency of tissue monocytes, identified in tissues as in Fig. 1A, was analyzed after liposomal clodronate injection i. v. and normalized to B cells in blood and lung (A) and LNs (B). Data are representative of four experiments,2-4 mice per group. C) Overlay of lung DCs and monocytes gated from tissues after anti-CD45 was given i.v. 2 min. before euthanasia. D) BrdU pulse-chase analysis of tissue monocytes, n = 5. E) Plots depict chimerism between WT congenic parabionts at two weeks (left) and WT chimerism in _Ccr2_−/− hosts parabiosed with a WT partner for 1 year (right). Each bar includes 2-8 parabionts and depicts mean ± SEM. Mo,monocyte; Mac, macrophage. Fig. S4 accompanies this figure.
Figure 5. Commensals are not required for monocyte trafficking to tissue and LNs
A) The frequency of monocytes relative to all live cells in lung-draining (LLN), skin-draining (SLN) and mesenteric LNs (MLN) was quantified. B) Monocyte frequency in SLN and MLN of WT and germ-free mice. Monocyte (B) and neutrophil (C) frequency in skin of conventionally housed (CH) germ-free (GF) mice. D) Blood monocyte count in CH or GF mice. Each symbol, data from an individual mouse with mean ± SEM shown by bars within each dataset.
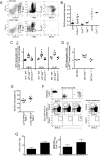
Figure 6. Tissue monocytes migrate to and from tissue to LNs via afferent lymphatics
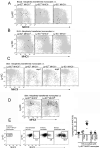
A) Skin from WT and _Ccr2_−/− mice were analyzed for monocytes (gated center plots). Data are representative of two independent experiments. B) Scatter plot of MLN monocyte frequency in WT, _Cx3cr1_gfp/gfp, _Ccr2_−/−, _Sell_−/−, plt/plt and _Ccr7_−/− mice. C and D) Mice were reconstituted with 1:1 mixture of CD45.1+ WT and CD45.2+ _Sell_−/− bone marrow (BM) cells (WT:_Sell_−/−); CD45.1+ WT and CD45.2+ _Ccr7_−/− BM cells (WT:_Ccr7_−/−); or CD45.1+ WT and CD45.2+ WT BM cells (WT:WT) as control. The frequency of LN (C) and skin (D) CD45.1 Ly-6C+MHCII+ WT monocytes was normalized to the frequency of CD45.1 Ly-6C+MHCII+ blood monocytes in the same mouse. E) In WT:_Sell_−/− chimeric mice, the frequency of blood monocyte subsets derived from _Sell_−/− BM cells was plotted. F) WT CD45.2+ blood monocytes were sorted to generate purified populations of Ly-6C+MHCII−, Ly-6C−MHCII− and Ly-6C−MHCII+ cells (top plots). Sorted CD45.2 monocytes were adoptively transferred into the back skin of CD45.1 mice, and 24 h later, SLNs were analyzed for migration (lower plots). Representative data are shown from 3 independent experiments. G) Left, bar graph shows the frequency of OVA+ monocytes from total monocytes in the LLN. Right, bar graph shows the ratio of the total number of OVA+ DC over OVA+ monocytes in the LLN. Bars depict mean ± SEM. Data are representative of three independent experiments. Fig. S5 accompanies this figure.
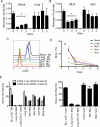
Figure 7. Conversion of Ly-6C+MHCII− to Ly-6C+MHCII+ monocytes in vivo and in culture with endothelium
CD115+GFP+ blood monocyte subsets Ly-6C+MHCII+, Ly-6C+MHCII−, and Ly-6C−MHCII− were sorted from CD45.2 _Cx3cr1_gfp/gfp mice. Sorted monocytes 1×10⁶ Ly-6C+MHCII−, 3×10⁵ Ly-6C+MHCII+ or 1×10⁶ Ly-6C−MHCII− were injected i.v. into CD45.1+ WT mice, followed by i.d. injection of 2 μg LPS. At 18 h, (A) blood, (B) skin-draining LNs (SLN), and (C) skin were analyzed for monocytes migration and differentiation. Dot plot overlays display total CD11b+ cells (gray) and CD45.2 GFP+ adoptively transferred cells (black). C) Skin illustrates two separate experiments (exp 1, exp 2) adoptively transferring Ly-6C+MHCII− monocytes. D) Purified Ly-6C+MHCII− and Ly-6C+MHCII+ blood monocytes were injected intradermally into skin and recovered 18 h later to assess MHC II expression. E) Splenic Ly-6C+MHCII− monocytes, depleted completely of MHC II+ cells, were enriched by negative selection and cocultured with various cell types as shown. Ly-6C+ monocytes were gated before and after the cocultures and the induction of surface MHC II was assessed and plotted (on the right). Each data point represents one experiment.
Similar articles
- A Consistent Method to Identify and Isolate Mononuclear Phagocytes from Human Lung and Lymph Nodes.
Gibbings SL, Jakubzick CV. Gibbings SL, et al. Methods Mol Biol. 2018;1799:381-395. doi: 10.1007/978-1-4939-7896-0_28. Methods Mol Biol. 2018. PMID: 29956166 Free PMC article. - Monocytes as effector cells: activated Ly-6C(high) mouse monocytes migrate to the lymph nodes through the lymph and cross-present antigens to CD8+ T cells.
Leirião P, del Fresno C, Ardavín C. Leirião P, et al. Eur J Immunol. 2012 Aug;42(8):2042-51. doi: 10.1002/eji.201142166. Epub 2012 Jul 9. Eur J Immunol. 2012. PMID: 22585535 - Lymph-migrating, tissue-derived dendritic cells are minor constituents within steady-state lymph nodes.
Jakubzick C, Bogunovic M, Bonito AJ, Kuan EL, Merad M, Randolph GJ. Jakubzick C, et al. J Exp Med. 2008 Nov 24;205(12):2839-50. doi: 10.1084/jem.20081430. Epub 2008 Nov 3. J Exp Med. 2008. PMID: 18981237 Free PMC article. - Migratory fate and differentiation of blood monocyte subsets.
Tacke F, Randolph GJ. Tacke F, et al. Immunobiology. 2006;211(6-8):609-18. doi: 10.1016/j.imbio.2006.05.025. Epub 2006 Jul 10. Immunobiology. 2006. PMID: 16920499 Review. - Insights how monocytes and dendritic cells contribute and regulate immune defense against microbial pathogens.
Bieber K, Autenrieth SE. Bieber K, et al. Immunobiology. 2015 Feb;220(2):215-26. doi: 10.1016/j.imbio.2014.10.025. Epub 2014 Oct 31. Immunobiology. 2015. PMID: 25468558 Review.
Cited by
- Origin, Localization, and Immunoregulatory Properties of Pulmonary Phagocytes in Allergic Asthma.
Hoffmann F, Ender F, Schmudde I, Lewkowich IP, Köhl J, König P, Laumonnier Y. Hoffmann F, et al. Front Immunol. 2016 Mar 23;7:107. doi: 10.3389/fimmu.2016.00107. eCollection 2016. Front Immunol. 2016. PMID: 27047494 Free PMC article. Review. - Current Sarcoidosis Models and the Importance of Focusing on the Granuloma.
Locke LW, Schlesinger LS, Crouser ED. Locke LW, et al. Front Immunol. 2020 Aug 4;11:1719. doi: 10.3389/fimmu.2020.01719. eCollection 2020. Front Immunol. 2020. PMID: 32849608 Free PMC article. Review. - The Differentiation of Human Cytomegalovirus Infected-Monocytes Is Required for Viral Replication.
Min CK, Shakya AK, Lee BJ, Streblow DN, Caposio P, Yurochko AD. Min CK, et al. Front Cell Infect Microbiol. 2020 Jul 31;10:368. doi: 10.3389/fcimb.2020.00368. eCollection 2020. Front Cell Infect Microbiol. 2020. PMID: 32850474 Free PMC article. Review. - CD11c(+) monocyte/macrophages promote chronic Helicobacter hepaticus-induced intestinal inflammation through the production of IL-23.
Arnold IC, Mathisen S, Schulthess J, Danne C, Hegazy AN, Powrie F. Arnold IC, et al. Mucosal Immunol. 2016 Mar;9(2):352-63. doi: 10.1038/mi.2015.65. Epub 2015 Aug 5. Mucosal Immunol. 2016. PMID: 26242598 Free PMC article. - An Eye on Kupffer Cells: Development, Phenotype and the Macrophage Niche.
Elchaninov A, Vishnyakova P, Menyailo E, Sukhikh G, Fatkhudinov T. Elchaninov A, et al. Int J Mol Sci. 2022 Aug 30;23(17):9868. doi: 10.3390/ijms23179868. Int J Mol Sci. 2022. PMID: 36077265 Free PMC article. Review.
References
- Coggle JE, Tarling JD. The proliferation kinetics of pulmonary alveolar macrophages. J Leukoc Biol. 1984;35:317–327. - PubMed
Publication types
MeSH terms
Substances
Grants and funding
- R37 AI049653/AI/NIAID NIH HHS/United States
- R24AI072073/AI/NIAID NIH HHS/United States
- P50 GM071558/GM/NIGMS NIH HHS/United States
- AI049653/AI/NIAID NIH HHS/United States
- T32 CA009547/CA/NCI NIH HHS/United States
- DK052574/DK/NIDDK NIH HHS/United States
- P30 CA046934/CA/NCI NIH HHS/United States
- R01 AI049653/AI/NIAID NIH HHS/United States
- R01 GM098316/GM/NIGMS NIH HHS/United States
- R24 AI072073/AI/NIAID NIH HHS/United States
- R01 HL081151/HL/NHLBI NIH HHS/United States
- T32CA009547/CA/NCI NIH HHS/United States
- HL115334/HL/NHLBI NIH HHS/United States
- P30 DK052574/DK/NIDDK NIH HHS/United States
- HL81151/HL/NHLBI NIH HHS/United States
- R01 HL115334/HL/NHLBI NIH HHS/United States
LinkOut - more resources
Full Text Sources
Other Literature Sources
Molecular Biology Databases
Research Materials
