Metrics other than potency reveal systematic variation in responses to cancer drugs - PubMed (original) (raw)
Metrics other than potency reveal systematic variation in responses to cancer drugs
Mohammad Fallahi-Sichani et al. Nat Chem Biol. 2013 Nov.
Abstract
Large-scale analysis of cellular response to anticancer drugs typically focuses on variation in potency (half-maximum inhibitory concentration, (IC50)), assuming that it is the most important difference between effective and ineffective drugs or sensitive and resistant cells. We took a multiparametric approach involving analysis of the slope of the dose-response curve, the area under the curve and the maximum effect (Emax). We found that some of these parameters vary systematically with cell line and others with drug class. For cell-cycle inhibitors, Emax often but not always correlated with cell proliferation rate. For drugs targeting the Akt/PI3K/mTOR pathway, dose-response curves were unusually shallow. Classical pharmacology has no ready explanation for this phenomenon, but single-cell analysis showed that it correlated with significant and heritable cell-to-cell variability in the extent of target inhibition. We conclude that parameters other than potency should be considered in the comparative analysis of drug response, particularly at clinically relevant concentrations near and above the IC50.
Conflict of interest statement
COMPETING FINANCIAL INTERESTS STATEMENT
The authors declare no financial conflict of interest.
Figures
Figure 1
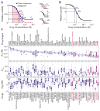
Diversity of anti-cancer compounds with respect to variation in dose-response parameters across a panel of breast cell lines. (a) Schematic of key dose-response parameters (EC50, IC50, Einf, Emax and AUC) calculated following curve fitting to the cell survival data. The pink area represents area under the curve (AUC). The red dash line represents the simple case of E0 = 1, Emax = Einf = 0, EC50 = IC50 and HS = 1. Effects of variations in EC50, slope (HS), and Einf on the shape of dose-response curve are shown on the right; see text for details of parameters and logistic equation. (b) Schematic of key dose-response parameters (GI50, TGI) that can be calculated by fitting logistic curves to data on relative cell growth comprising a change in cell number after drug treatment normalized to the change in cell number in an untreated control well. (c) The range of dose-response parameters, IC50 (a measure of potency), Emax (a measure of efficacy), and Hill slope (HS) estimated for all 64 compounds across all the 53 breast cell lines represented by box and whisker plots drawn and median parameter values and inter-quartile ranges; bars extending to 1.5-times the inter-quartile range are shown for each drug as a measure of variance. Parameter values for outlier cell lines are denoted by stars. Compounds are sorted based on the median IC50 value. Drug targets are nominal and do not include off-target effects.
Figure 2
Selected examples of dose-response curves representing different types of variation in dose-response relationships. Patterns of dose-response across the breast cell line panel for (a) docetaxel, a microtubule stabilizer, (b) geldanamycin, an HSP90 inhibitor, (c) fascaplysin, a CDK4 inhibitor, (d) CGC-11144, a polyamine analogue, and (e) GSK2126458, a PI3K inhibitor are shown. These drugs are highlighted in red in Fig. 1c. The range of IC50 and Emax values is represented by box and whisker plots drawn and median parameter values and inter-quartile ranges shown above and to the right; bars extending to 1.5-times the inter-quartile range are shown for each drug as a measure of variance. Parameter values for outlier cell lines are denoted by stars.
Figure 3
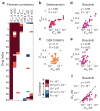
Different dose-response parameters do not always correlate with each other. (a) Pairwise correlation between different key dose-response parameters estimated for each drug across the breast cancer cell line collection. P values were corrected using the Bonferroni-Holm method. A complete view of panel (a) including drug names corresponding to each drug index is presented in Supplementary Fig. 1. Correlation coefficient values and corrected P values are presented in Supplementary Data Set 3. (b, c) Pairwise distribution and correlation of Emax and IC50 for geldanamycin (an HSP90 inhibitor) and GSK1059615 (a PI3K inhibitor). (d–f) Pairwise distribution and correlation of Emax, IC50 and GI50 for bosutinib (a Src/Abl inhibitor) across the cell line panel. Each circle represents a cell line. Colors represent different drugs.
Figure 4
Association of dose-response parameters with cell type, drug type and drug class. (a) An example showing that two cell lines (SUM159PT and SKBR3) are distinguishable by Emax values with SUM159PT cells having lower values for all but three compounds. Significance of difference between the Emax values for the two cell lines was evaluated by a P value based on nonparametric Wilcoxon signed rank test. (b) Correlation between different dose-response parameters estimated for the set of anti-cancer compounds and the doubling times across the breast cell lines. Drugs are grouped in two groups: cell cycle phase-specific and –nonspecific drugs. See Supplementary Fig. 2 for the complete list of drugs in each group. The percentage of drugs within each group that exhibit significant correlation (P < 0.05) between doubling time and parameters Emax and IC50 is shown. P values were corrected using the Benjamini-Hochberg method. Correlation coefficient values and corresponding P values are presented in Supplementary Data Set 4. (c–e) Three examples of anti-cancer drugs that are distinguishable based on dose-response parameter values across the breast cell line panel as discovered by mutual information analysis. The Significance of differences between drugs was evaluated by P values based on nonparametric Wilcoxon signed rank test. (f) Variation of Emax and Hill slope for different classes of drugs defined based on target or mechanism of action across the breast cell lines. Significance of differences between drug classes was evaluated by P values based on nonparametric Mann-Whitney U test and corrected using Bonferroni-Holm method.
Figure 5
High cell-to-cell variability is associated with shallow dose-response and suboptimal maximum effect for pharmacological inhibition of mTOR. (a) PI3K/Akt/mTOR pathway and its associated downstream effectors. Highly simplified schematic showing how drug response was assessed by measuring levels of phosphorylated Akt, S6 ribosomal protein, 4EBP1 and Rb on a single-cell level by immunofluorescence microscopy. (b) Dose-dependent inhibition of p-4EBP1 with increasing drug concentrations as illustrated by intensity values on a single-cell basis. (c) Selected immunofluorescence images of p-4EBP1 (green), p-Rb (red) and Hoechst (blue) staining of MCF10A cells in the absence of drug and 24 hr after exposure to 10 μM PP242. (d) The effect of PP242, dactolisib and GSK1059615 on coefficient of variation (CV; the standard deviation for single cell measurements divided by the population-average) of single cell p-4EBP1 levels. Data represent mean values ± s.d. calculated from two replicates per dose of drug. (e) Cells with high p-4EBP1 levels (i.e. cells with p-4EBP1 levels above the population average) 24 hr after exposure to 10 μM PP242 exhibit >10 times higher levels of p-Rb than low-p4EBP1 cells (cells with p-4EBP1 levels below the population average). Median p-Rb signal intensities and inter-quartile ranges, and bars extending to 1.5-times the inter-quartile range are shown. (f) Retreating surviving MCF10A cells (exposed to 10 μM PP242 for 72 hr followed by fresh growth media for 24 hr) with 9 doses of PP242 for 72 hr results in a shallow dose-response curve with similar dose-response parameters as observed for parental cells.
Figure 6
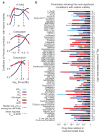
Different dose-response parameters capture cell line to cell line variation at different dose regimes. (a) Variations of the predictive value (coefficient of Pearson correlation with relative viability) for each of the three key dose-response parameters (IC50, Emax and AUC) with dose for three selected drugs, 17-AAG, carboplatin and doxorubicin. (b) Predictive value of different dose-response parameters for drug sensitivity is a function of the clinical concentration of drug. Dose-response parameters corresponding to the most significant correlation (as evaluated by P value) with cellular response (i.e. relative viability) at doses spanning a range from the most sensitive cell line’s IC50 to the highest tested dose for each drug are shown. For example for the mTOR inhibitor PP242, EC50 (denoted by green bar) is the parameter with the highest correlation with relative viability when cell lines are exposed to drug concentrations around 10−4 times the maximal tested dose (i.e. 10−5×10−4.3 M 0.5 nM). At a 100-fold higher concentration (i.e. 10−3×10−4.3 M ≈ 50 nM), AUC (denoted by red bar) shows the strongest correlation with relative viability.
Comment in
- Drug discovery: Rethinking cellular drug response.
Jenkins JL. Jenkins JL. Nat Chem Biol. 2013 Nov;9(11):669-70. doi: 10.1038/nchembio.1365. Nat Chem Biol. 2013. PMID: 24141220 No abstract available.
Similar articles
- Benzo[b]furan derivatives induces apoptosis by targeting the PI3K/Akt/mTOR signaling pathway in human breast cancer cells.
Kamal A, Lakshma Nayak V, Nagesh N, Vishnuvardhan MV, Subba Reddy NV. Kamal A, et al. Bioorg Chem. 2016 Jun;66:124-31. doi: 10.1016/j.bioorg.2016.04.004. Epub 2016 Apr 26. Bioorg Chem. 2016. PMID: 27149364 - Phosphorylation of AKT and ERK1/2 and mutations of PIK3CA and PTEN are predictive of breast cancer cell sensitivity to everolimus in vitro.
Citi V, Del Re M, Martelli A, Calderone V, Breschi MC, Danesi R. Citi V, et al. Cancer Chemother Pharmacol. 2018 Apr;81(4):745-754. doi: 10.1007/s00280-018-3543-6. Epub 2018 Feb 23. Cancer Chemother Pharmacol. 2018. PMID: 29476223 - Potentiation of Growth Inhibitory Responses of the mTOR Inhibitor Everolimus by Dual mTORC1/2 Inhibitors in Cultured Breast Cancer Cell Lines.
Leung EY, Askarian-Amiri M, Finlay GJ, Rewcastle GW, Baguley BC. Leung EY, et al. PLoS One. 2015 Jul 6;10(7):e0131400. doi: 10.1371/journal.pone.0131400. eCollection 2015. PLoS One. 2015. PMID: 26148118 Free PMC article. - Current status and future perspectives of PI3K and mTOR inhibitor as anticancer drugs in breast cancer.
Zhang X, Li XR, Zhang J. Zhang X, et al. Curr Cancer Drug Targets. 2013 Feb;13(2):175-87. doi: 10.2174/1568009611313020007. Curr Cancer Drug Targets. 2013. PMID: 23215724 Review. - Recent Development in Indole Derivatives as Anticancer Agents for Breast Cancer.
Kaur K, Jaitak V. Kaur K, et al. Anticancer Agents Med Chem. 2019;19(8):962-983. doi: 10.2174/1871520619666190312125602. Anticancer Agents Med Chem. 2019. PMID: 30864529 Review.
Cited by
- JNK Pathway Activation Modulates Acquired Resistance to EGFR/HER2-Targeted Therapies.
Manole S, Richards EJ, Meyer AS. Manole S, et al. Cancer Res. 2016 Sep 15;76(18):5219-28. doi: 10.1158/0008-5472.CAN-16-0123. Epub 2016 Jul 22. Cancer Res. 2016. PMID: 27450453 Free PMC article. - Repurposed drugs and their combinations prevent morbidity-inducing dermonecrosis caused by diverse cytotoxic snake venoms.
Hall SR, Rasmussen SA, Crittenden E, Dawson CA, Bartlett KE, Westhorpe AP, Albulescu LO, Kool J, Gutiérrez JM, Casewell NR. Hall SR, et al. Nat Commun. 2023 Dec 14;14(1):7812. doi: 10.1038/s41467-023-43510-w. Nat Commun. 2023. PMID: 38097534 Free PMC article. - Leveraging Mathematical Modeling to Quantify Pharmacokinetic and Pharmacodynamic Pathways: Equivalent Dose Metric.
McKenna MT, Weis JA, Quaranta V, Yankeelov TE. McKenna MT, et al. Front Physiol. 2019 May 22;10:616. doi: 10.3389/fphys.2019.00616. eCollection 2019. Front Physiol. 2019. PMID: 31178753 Free PMC article. - Targeting pan-essential pathways in cancer with cytotoxic chemotherapy: challenges and opportunities.
Rudd SG. Rudd SG. Cancer Chemother Pharmacol. 2023 Oct;92(4):241-251. doi: 10.1007/s00280-023-04562-3. Epub 2023 Jul 15. Cancer Chemother Pharmacol. 2023. PMID: 37452860 Free PMC article. Review. - Two-level modeling approach to identify the regulatory dynamics capturing drug response heterogeneity in single-cells.
Chaves M, Gomes-Pereira LC, Roux J. Chaves M, et al. Sci Rep. 2021 Oct 21;11(1):20809. doi: 10.1038/s41598-021-99943-0. Sci Rep. 2021. PMID: 34675364 Free PMC article.
References
- Borden EC, Dowlati A. Phase I trials of targeted anticancer drugs: a need to refocus. Nat Rev Drug Discov. 2012;11:889–890. - PubMed
Publication types
MeSH terms
Substances
LinkOut - more resources
Full Text Sources
Other Literature Sources
Medical
Molecular Biology Databases
Miscellaneous


