Molecular composition and ultrastructure of the caveolar coat complex - PubMed (original) (raw)
Molecular composition and ultrastructure of the caveolar coat complex
Alexander Ludwig et al. PLoS Biol. 2013.
Abstract
Caveolae are an abundant feature of the plasma membrane of many mammalian cell types, and have key roles in mechano-transduction, metabolic regulation, and vascular permeability. Caveolin and cavin proteins, as well as EHD2 and pacsin 2, are all present in caveolae. How these proteins assemble to form a protein interaction network for caveolar morphogenesis is not known. Using in vivo crosslinking, velocity gradient centrifugation, immuno-isolation, and tandem mass spectrometry, we determine that cavins and caveolins assemble into a homogenous 80S complex, which we term the caveolar coat complex. There are no further abundant components within this complex, and the complex excludes EHD2 and pacsin 2. Cavin 1 forms trimers and interacts with caveolin 1 with a molar ratio of about 1∶4. Cavins 2 and 3 compete for binding sites within the overall coat complex, and form distinct subcomplexes with cavin 1. The core interactions between caveolin 1 and cavin 1 are independent of cavin 2, cavin 3, and EHD2 expression, and the cavins themselves can still interact in the absence of caveolin 1. Using immuno-electron microscopy as well as a recently developed protein tag for electron microscopy (MiniSOG), we demonstrate that caveolar coat complexes form a distinct coat all around the caveolar bulb. In contrast, and consistent with our biochemical data, EHD2 defines a different domain at the caveolar neck. 3D electron tomograms of the caveolar coat, labeled using cavin-MiniSOG, show that the caveolar coat is composed of repeating units of a unitary caveolar coat complex.
Conflict of interest statement
The authors have declared that no competing interests exist.
Figures
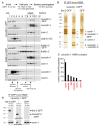
Figure 1. Caveolins and cavins assemble into an 80S complex.
(A) HeLa cells were cross-linked with DSP and solubilised in 1% Triton X-100/1% octyl glucoside. Lysates were fractionated on 10–40% sucrose gradients, followed by Western blotting of gradient fractions 1–12 using antibodies against caveolin 1, cavin 1, GFP, clathrin heavy chain, or flotillin 2. Gradients were prepared from cells expressing caveolin-1-GFP (top panel) or flotillin-2-GFP as a control (middle panel). The bottom panel shows a gradient from flotillin-2-GFP expressing cells that had not been cross-linked prior to cell lysis. The high molecular weight (HMW) peak 8–10 of caveolin 1 and cavin 1 is boxed. The distribution of molecular weight protein standards in the gradients is indicated on the bottom. (B) Caveolin-1-GFP or flotillin-2-GFP (to provide a control) was immuno-isolated from pooled gradient fractions 8–10, indicated “HMW” in (A). A control immuno-isolation was also performed from fractions 8–10 of cells expressing GFP. Eluted proteins were visualized by silver staining. Cavin 1, caveolin-1-GFP, cavin 3, and caveolins are indicated. The bands specific to the flotillin-2-GFP immunoprecipitation, marked with asterisks (*) are flotillin-2-GFP, and endogenous flotillins 1 and 2. (C) The caveolin 1 HMW complex was analyzed by LC-MS/MS, and the graph shows the number of peptides for each protein identified. Proteins are ranked left to right by number of peptides identified. (D) Western blots of the starting material (In) and unbound material (Un) after immuno-isolation of caveolin-1-GFP, flotillin-2-GFP, or GFP from pooled HMW fractions 8–10. Membranes were probed with anti-GFP or anti-cavin 1 antibodies.
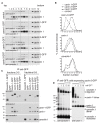
Figure 2. There is a single species of caveolar coat complex.
(A) Cross-linked and detergent solubilised (1% Triton X-100/1% octyl glucoside) HeLa cell extracts were fractionated by velocity centrifugation (10–40% sucrose), followed by Western blotting of fractions 1–12. Gradients were prepared from cells expressing either GFP (the control cells), cavin 1-GFP, cavin 2-GFP, or cavin 3-GFP. Membranes were probed with antibodies against caveolin 1, cavin 1, cavin 3, or GFP. The high molecular weight (HMW) peak of caveolin 1 and cavins is boxed. The strong band in the cavin 3 blot (marked with an asterisk (*); fractions 1–4) are nonspecific: they are also observed in cavin 3 knockout cells and in HeLa cells depleted of cavin 3 by siRNA (see Figure 5A). (B) Quantification of the distribution of cavin 1, 2, and-3-GFP, cavin 1, and caveolin 1 in velocity gradients as shown in (A). Relative protein amounts were determined by densitometry of Western blots. The data are expressed as an average percentage of protein in each fraction calculated from four independent experiments. Control was GFP-expressing cells. (C) Cavin 1, 2, and-3-GFP were immuno-isolated from pooled gradient HMW fractions 8–10. Control immuno-isolations were performed from pooled fractions 8–10 of cells expressing GFP or flotillin-2-GFP. Eluted proteins were analysed by Western blotting using antibodies against GFP, cavin 1, caveolin 1, EHD2, and pacsin 2. Note the absence of EHD2 and pacsin 2 from the caveolar coat complex. (D) HMW complexes immuno-isolated from cross-linked HeLa cells expressing caveolin-1-GFP, or cavin 1, 2, or-3-GFP were analyzed by LC-MS/MS. The graph is showing the number of peptides identified from caveolin 1 and cavin proteins in each complex. Other proteins identified by mass spectrometry are not shown.
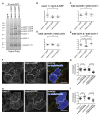
Figure 3. The caveolar coat complex has a defined stoichiometry.
(A) Cells expressing GFP, cavin-1-GFP, cavin-2-GFP, or cavin-3-GFP were cross-linked and lysed in 1% Triton X-100/1% octyl glucoside, followed by immuno-isolation of the complexes using anti-GFP antibodies. Eluted proteins were separated by SDS-PAGE and stained with Sypro Ruby. (B–E) Quantification of the relative molar ratios between cavin 1, 2, -3-GFP, cavin 1, cavin 3, and caveolins in the caveolar coat complex. Shown are the means +/− standard error determined from 6–8 independent experiments. Student t test was used to determine significant differences between samples. (F) Confocal microscopy to show levels of cavin 1, detected by indirect immunofluorescence, and cavin-3-GFP, in cells overexpressing high levels of cavin-2-mCherry. Cavin-3-GFP is stably transfected in these cells. Cavin-2-mCherry is shown in blue in the overlay panel, and the same cells are outlined in the other panels. (G) Quantification of fluorescence intensity from cells as in (F). Cavin 1 and cavin-3-GFP intensities are normalised so that the mean signal in cells without cavin-2-mCherry is always 1. Data from a single experiment are shown, each data point representing a single cell. The experiment was repeated three times with equivalent results. (H and I) These represent essentially the same experiments as in (F) and (G), except that here the effect of overexpressing cavin-3-mCherry in cells stably transfected with cavin-2-GFP was examined.
Figure 4. Cavin 2 and cavin 3 form distinct subcomplexes with cavin 1 and caveolin 1.
(A) Gradient fractions (10–40% sucrose) of non-cross-linked and detergent solubilised (1% Triton X-100) HeLa cell extracts were analysed by Western blotting. Gradients were prepared from cells expressing either GFP (as control cells), cavin 1-GFP, cavin 2-GFP, or cavin 3-GFP. Membranes were probed with antibodies against caveolin 1, cavin 1, or GFP. Pooled fractions 3–5 and 6–8 used for immuno-isolation shown in (C) are boxed. (B) Quantification of the distribution of cavin 1, 2, and-3-GFP, cavin 1, and caveolin-1 in velocity gradients as shown in (A). Relative protein amounts were determined by densitometry of Western blots. The data are expressed as an average percentage of protein in each fraction calculated from four independent experiments. (C) Cavin 1, 2, and -3-GFP, flotillin-2-GFP, caveolin-1-GFP, or GFP were immuno-isolated from gradient fractions 3–5 or 6–8 as shown in (A). Eluted proteins were analysed by Western blotting using antibodies against GFP, cavin 1, or caveolin 1. (D) Caveolar coat complexes immuno-isolated from cross-linked HeLa cells stably expressing cavin-2-GFP were incubated with increasing concentrations of DTT to partially reduce crosslinks and analyzed by Western blotting using anti-caveolin 1 or anti-cavin 1 antibodies. Monomeric and oligomeric species of caveolin 1 and cavin 1 are indicated. Note the 180 kDa cavin 1 trimer.
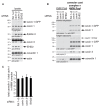
Figure 5. A core complex containing cavin 1 and caveolin 1 is independent of cavin 2, cavin 3, and EHD2 expression.
(A) Western blotting of cell lysates from siRNA-treated cells. Blots were probed with the anitbodies indicated. * indicates the nonspecific band obtained with anti-cavin-3 antibodies. (B) Western blotting of fractions 3 to 5 (LMW pool) and 8 to 10 (HMW pool: these fractions contain the caveolar coat complex) of sucrose velocity gradients analyzing the distribution of cavins and caveolin 1 from cells treated with the siRNAs shown. Blots of the entire gradients are shown in Figure S7B. (C) Quantification of the ratio between the amount of cavin 1 and caveolin 1 in fractions and 8 to 10 (HMW pool: these fractions contain the caveolar coat complex) of sucrose velocity gradients as shown in the blots in (B). Quantification is from densitometric scans of Western blots, and is based on three separate experiments; bars are SEM. In each experiment, all values were normalized so that the intensity of relevant bands in control flotillin 1 and 2 siRNA treated samples was 1.
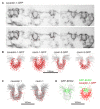
Figure 6. Cavins and caveolins are uniformly distributed around the caveolar bulb.
(A) HeLa cell lines stably transfected with either caveolin-1-GFP, cavin 1, 2, or-3-GFP were processed for immuno-electron microscopy, using anti-GFP primary antibodies, nanogold-conjugated secondary antibodies, and silver enhancement. Representative transmission EM images showing specific immuno-labeling of caveolin-1-GFP. (B) Membrane profiles and the localisation of gold particles (as shown in A) from about 50 caveolae per cell line as shown were superimposed; labeling was with anti-GFP antibodies as in (A). (C) HeLa cells were processed for immuno-electron microscopy using anti-caveolin 1 or cavin 1 primary antibodies, nanogold-conjugated secondary antibodies, and silver enhancement. Images represent superimposition of around 50 caveolae. (D) Membrane profiles and the localisation of gold particles (as shown in A) from about 50 caveolae from GFP-EHD2 expressing cells were superimposed; labeling was with anti-GFP antibodies as in (A).
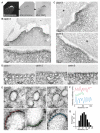
Figure 7. MiniSOG labeling shows that cavins are distributed around the caveolar bulb, with periodic density maxima.
RPE cells stably transfected with cavin 1, 2, or 3-MiniSOG-mCherry were photooxidized and processed for correlative light and electron microscopy. (A) Representative light microscopy images showing an RPE cell expressing cavin-3-MiniSOG-mCherry before (left) and after photooxidation (middle), and after osmification and plastic embedding (right). (B) Correlative electron micrograph of the photooxidized region shown in (A). The bottom electron micrograph shows the boxed region shown in (B), acquired at higher magnification. (C) Representative transmission electron micrographs of RPE cells stably expressing cavin-1-MiniSOG-mCherry (top) and cavin-2-MiniSOG-mCherry (bottom). (D) Representative electron micrographs for all three cavin-MiniSOG-mCherry showing caveolae visibly open to the outside of the cell. Note that MiniSOG label is found all around the caveolar bulb. Asterisks highlight background contrast produced by osmium stain in adjacent cells. (E) Representative electron micrographs of photooxidized regions of RPE cells stably transfected with cavin 1, 2, or 3-MiniSOG-mCherry. Areas showing regular spacing between densities produced by MiniSOG are boxed and shown enlarged on the bottom. (F) Line scans illustrating periodic density maxima as shown in (E). (G) Quantification of the distances between density maxima produced by cavin-MiniSOG-mCherry (n = 176).
Figure 8. Tomographic reconstruction of the caveolar coat stained with cavin-3-MiniSOG.
Tomograms were recorded from representative regions of photooxidized RPE cells stably transfected with cavin-3-miniSOG-mCherry. (A) x/y projection of a typical tomogram acquired at 150 kV, 18k at a pixel size of 0.5 nm. The backprojection shown was binned by 2, resulting in a pixel size of 1 nm. (B and C) Line scans through density maxima observed in x/y projections. (B) Line scans were performed perpendicular to the membrane and the relative intensity plotted against distance, including error bars (n = 11). (C) Representative line scan along the membrane showing regular spacing between local maxima. Note that distances of about 8–10 nm can be resolved. (D) Three-dimensional representation of the caveolar coat stained with cavin-3-MiniSOG, for two separate caveolae. From left to right: x/y backprojections of representative caveolae; surfaces of the caveolae shown on the left; maximum intensity projection of the boxed area shown in column 2; surface rendering of the boxed area shown in column 2.
Similar articles
- Architecture of the caveolar coat complex.
Ludwig A, Nichols BJ, Sandin S. Ludwig A, et al. J Cell Sci. 2016 Aug 15;129(16):3077-83. doi: 10.1242/jcs.191262. Epub 2016 Jul 1. J Cell Sci. 2016. PMID: 27369768 Free PMC article. - Endocytic crosstalk: cavins, caveolins, and caveolae regulate clathrin-independent endocytosis.
Chaudhary N, Gomez GA, Howes MT, Lo HP, McMahon KA, Rae JA, Schieber NL, Hill MM, Gaus K, Yap AS, Parton RG. Chaudhary N, et al. PLoS Biol. 2014 Apr 8;12(4):e1001832. doi: 10.1371/journal.pbio.1001832. eCollection 2014 Apr. PLoS Biol. 2014. PMID: 24714042 Free PMC article. - EHD2 regulates caveolar dynamics via ATP-driven targeting and oligomerization.
Morén B, Shah C, Howes MT, Schieber NL, McMahon HT, Parton RG, Daumke O, Lundmark R. Morén B, et al. Mol Biol Cell. 2012 Apr;23(7):1316-29. doi: 10.1091/mbc.E11-09-0787. Epub 2012 Feb 9. Mol Biol Cell. 2012. PMID: 22323287 Free PMC article. - The role of membrane-shaping BAR domain proteins in caveolar invagination: from mechanistic insights to pathophysiological consequences.
Kessels MM, Qualmann B. Kessels MM, et al. Biochem Soc Trans. 2020 Feb 28;48(1):137-146. doi: 10.1042/BST20190377. Biochem Soc Trans. 2020. PMID: 32104881 Review. - Cavin family proteins and the assembly of caveolae.
Kovtun O, Tillu VA, Ariotti N, Parton RG, Collins BM. Kovtun O, et al. J Cell Sci. 2015 Apr 1;128(7):1269-78. doi: 10.1242/jcs.167866. J Cell Sci. 2015. PMID: 25829513 Free PMC article. Review.
Cited by
- Defining the Assembleome of the Respiratory Syncytial Virus.
Sugrue RJ, Tan BH. Sugrue RJ, et al. Subcell Biochem. 2023;106:227-249. doi: 10.1007/978-3-031-40086-5_9. Subcell Biochem. 2023. PMID: 38159230 Review. - Cells respond to deletion of CAV1 by increasing synthesis of extracellular matrix.
Mendoza-Topaz C, Nelson G, Howard G, Hafner S, Rademacher P, Frick M, Nichols BJ. Mendoza-Topaz C, et al. PLoS One. 2018 Oct 22;13(10):e0205306. doi: 10.1371/journal.pone.0205306. eCollection 2018. PLoS One. 2018. PMID: 30346954 Free PMC article. - Cavin-3 knockout mice show that cavin-3 is not essential for caveolae formation, for maintenance of body composition, or for glucose tolerance.
Liu L, Hansen CG, Honeyman BJ, Nichols BJ, Pilch PF. Liu L, et al. PLoS One. 2014 Jul 18;9(7):e102935. doi: 10.1371/journal.pone.0102935. eCollection 2014. PLoS One. 2014. PMID: 25036884 Free PMC article. - The trafficking protein, EHD2, positively regulates cardiac sarcolemmal KATP channel surface expression: role in cardioprotection.
Yang HQ, Jana K, Rindler MJ, Coetzee WA. Yang HQ, et al. FASEB J. 2018 Mar;32(3):1613-1625. doi: 10.1096/fj.201700027R. Epub 2018 Jan 3. FASEB J. 2018. PMID: 29133341 Free PMC article. - Cavin-3 (PRKCDBP) deficiency reduces the density of caveolae in smooth muscle.
Zhu B, Swärd K, Ekman M, Uvelius B, Rippe C. Zhu B, et al. Cell Tissue Res. 2017 Jun;368(3):591-602. doi: 10.1007/s00441-017-2587-y. Epub 2017 Mar 11. Cell Tissue Res. 2017. PMID: 28285351 Free PMC article.
References
- Palade GE (1953) Fine structure of blood capillaries. J Appl phys 24: 1424.
- Komarova Y, Malik AB (2010) Regulation of endothelial permeability via paracellular and transcellular transport pathways. Annu Rev Physiol 72: 463–493. - PubMed
- Hansen CG, Nichols BJ (2010) Exploring the caves: cavins, caveolins and caveolae. Trends Cell Biol 20: 177–186. - PubMed
Publication types
MeSH terms
Substances
Grants and funding
- P41 GM103412/GM/NIGMS NIH HHS/United States
- P41 RR004050/RR/NCRR NIH HHS/United States
- P41RR004050/RR/NCRR NIH HHS/United States
- P41GM103412-24/GM/NIGMS NIH HHS/United States
- MC_U105178778/MRC_/Medical Research Council/United Kingdom
LinkOut - more resources
Full Text Sources
Other Literature Sources
Molecular Biology Databases
Miscellaneous
