PU.1 target genes undergo Tet2-coupled demethylation and DNMT3b-mediated methylation in monocyte-to-osteoclast differentiation - PubMed (original) (raw)
PU.1 target genes undergo Tet2-coupled demethylation and DNMT3b-mediated methylation in monocyte-to-osteoclast differentiation
Lorenzo de la Rica et al. Genome Biol. 2013.
Abstract
Background: DNA methylation is a key epigenetic mechanism for driving and stabilizing cell-fate decisions. Local deposition and removal of DNA methylation are tightly coupled with transcription factor binding, although the relationship varies with the specific differentiation process. Conversion of monocytes to osteoclasts is a unique terminal differentiation process within the hematopoietic system. This differentiation model is relevant to autoimmune disease and cancer, and there is abundant knowledge on the sets of transcription factors involved.
Results: Here we focused on DNA methylation changes during osteoclastogenesis. Hypermethylation and hypomethylation changes took place in several thousand genes, including all relevant osteoclast differentiation and function categories. Hypomethylation occurred in association with changes in 5-hydroxymethylcytosine, a proposed intermediate toward demethylation. Transcription factor binding motif analysis revealed an over-representation of PU.1, NF-κB, and AP-1 (Jun/Fos) binding motifs in genes undergoing DNA methylation changes. Among these, only PU.1 motifs were significantly enriched in both hypermethylated and hypomethylated genes; ChIP-seq data analysis confirmed its association to both gene sets. Moreover, PU.1 interacts with both DNMT3b and TET2, suggesting its participation in driving hypermethylation and hydroxymethylation-mediated hypomethylation. Consistent with this, siRNA-mediated PU.1 knockdown in primary monocytes impaired the acquisition of DNA methylation and expression changes, and reduced the association of TET2 and DNMT3b at PU.1 targets during osteoclast differentiation.
Conclusions: The work described here identifies key changes in DNA methylation during monocyte-to-osteoclast differentiation and reveals novel roles for PU.1 in this process.
Figures
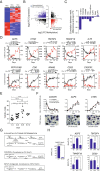
Figure 1
High-throughput methylation comparison between monocytes (MOs) and derived osteoclasts (OCs). (A) Heatmap including the data for three paired samples of MOs (MO D1, D2, D3) and their derived OCs (OC D1, D2, D3) harvested on day 21. The heatmap includes all CpG-containing probes displaying significant methylation changes (8,028 in total with FC ≥2 or FC ≤0.5; P ≤0.01 and FDR ≤0.05) (Additional file 2). Scale shown at the bottom, whereby beta values (that is, the ratio of the methylated probe intensity to the overall intensity, where overall intensity is the sum of methylated and unmethylated probe intensities) ranging from 0 (unmethylated, blue) to 1 (completely methylated, red). (B) Scatterplot showing the mean methylation profile of three matching MO/OC pairs. Genes with significant differences (FC >2, FDR <0.05) in averaged results from the three pairs of samples are highlighted in red (hypermethylated) or blue (hypomethylated). (C) Distribution of differentially methylated CpGs among genomic regions (promoter, gene bodies, 3′UTR, and intergenic) in different subsets of CpGs (hypomethylated, hypermethylated). (D) Gene ontology enrichment analysis of hypomethylated and hypermethylated CpGs showing the most important categories. (E) Technical validation of the array data by bisulfite pyrosequencing of modified DNA. BS pyrosequencing of three representative hypomethylated genes (ACP5, CTSK, and TM7SF4) and one hypermethylated gene (CX3CR1) from the array data are shown. A representation showing the excellent correlation between array data (beta values) and pyrosequencing data (% methylation) including the data for the four genes (right panel). (F) Cluster analysis of contiguous differentially methylated regions (<500 bp). Two examples of regions with more than nine consecutive CpGs differentially methylated are shown. (G) Analysis of methylation levels in repetitive elements (Sat2, D4Z4, NBL2) and ribosomal RNA genes (18S and 28S regions) as obtained from bisulfite sequencing analysis.
Figure 2
Dynamics of DNA methylation and its relationship with expression changes. (A) Heatmap showing expression levels on 0, 5, and 20 days for genes displaying significant methylation and expression changes (4,753 in total with FC ≥2 or FC ≤0.5; P ≤0.01 and FDR ≤0.05) (Additional file 7). (B) catterplots showing the relationship between the log2-transformed FC in expression and the log2-transformed FC in DNA methylation. Sixty-two percent of the hypomethylated genes are overexpressed (in blue); 55% of the hypermethylated genes are repressed (in red). (C) Correlation between methylation and expression data (slope from the linear regression between DNA methylation differences versus expression differences) for all differentially methylated genes organized by genomic location (first exon, TSS, 5′UTR, gene body, 3′UTR). (D) DNA methylation and expression dynamics of selected loci during monocyte-to-osteoclast differentiation. Methylation percentage determined by bisulfite pyrosequencing. Quantitative RT-PCR data relative to RPL38. DNA methylation and expression data are represented with a black line and a red line, respectively. (E) BrdU assay showing the percentage of replicating cells at different times. From days 1 to 4, only 9.46% of cells divide. (F) Effects of 5azadC treatment (50 nM, 500 nM) on osteoclastogenesis monitoring ACP5, CTSK, and CX3CR1 levels and TRAP staining over time. (G) Workflow for testing the presence of 5 hydroxymethylcytosine in hypomethylated genes. DNA was treated with a 5hmC-specific glucosyltransferase. Cytosines bearing a 5-hydroxymethyl are protected against MspI digestion, and the surrounding region can be amplified by qPCR. When no 5hmC is present, glucose is not transferred to C, DNA is cleaved at CCGG sites, and there is less qPCR amplification. Several controls are used to set the 0% and 100% content of 5hmC. (H) 5hmC content in several of the CpGs that are rapidly demethylated after RANKL and M-CSF stimulation of OC precursors.
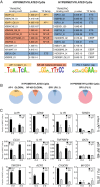
Figure 3
Association of transcription factors with DNA methylation changes during moncoyte to OC differentiation. (A) Significant enrichment of predicted TF (TRANSFAC motif) in hypo-/hypermethylated CpG sites regions. A 500-bp window centered around the hypo-/hypermethylated CpG sites was tested. The name of the transcription factor binding motif, the P value and the TF family are provided. Below we show three of the motifs that have a higher representation in this analysis. (B) Diagrams showing the percentage of hypo-/hypermethylated CpGs with AP-1, NF-kB, and PU.1 binding sites relative to the total number of hypo-/hypermethylated CpGs. (C) Quantitative ChIP assays showing the binding of three selected transcription factors (p65 NF-kB subunit, Fos, and PU.1 to target genes selected by the presence of the putative binding motifs according to the TRANSFAC analysis). Samples were analyzed at 0 and 2 days after RANKL/M-CSF stimulation. We used Sat2 repeats and the TRDR1 MyoD1 promoter as negative control sequences.
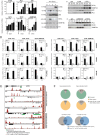
Figure 4
Interactions between PU.1 and DNTM3b and TET2 and association with promoters undergoing DNA methylation changes. (A) Quantitative RT-PCR analysis for CTSK, PU.1, p65 NF-kB, TET1, TET2, and DNMT3B during osteoclastogenesis. (B) Western blot for the same factors indicated above. (C) Immunoprecipitation experiment of p65 and PU.1 with DNMT3B and TET2 at 0, 2, and 4 days after RANKL and M-CSF stimulation. IgG used as a negative control. Reciprocal immunoprecipitation experiments in the bottom panel. (D) Quantitative ChIP assays showing PU.1, TET2, and DNMT3b binding to hypomethylated genes (ACP5, TM7SF4, TM4SF19) and hypermethylated genes (CX3CR1, NR4A2), all direct PU.1 targets, and a negative control (MYOD1 promoter) without PU.1 target sites. The experiment was performed with three biological triplicates but only one experiment is shown. T-student test comparing binding of each antibody between 0 days vs. 2 days was performed: * corresponds to P value <0.05; ** means P value <0.01; *** means P value <0.001. (E) Examples showing PU.1 binding (from ChIPseq data, GSE31621) to the region neighboring hypo- and hypermethylated CpGs. The PU.1 binding motif location is presented as a horizontal blue dot and the CpG displaying differential methylation (Illumina probe) between MO and OC is marked with a red bar. (F) Analysis of ChIPseq analysis for PU.1 and comparison to TRANSFAC predictions. Top panel: proportion of the CpG-containing probes displaying DNA methylation changes that have peaks for PU.1 binding in the same 500-bp window. Diagrams are separated in the hypo- and hypermethylated sets and in promoter and distal regions (gene bodies, 3′UTR, and intergenic regions). Bottom panel, Venn diagrams showing the overlap of PU.1 targets from ChIPseq data (GEO accession number: GSE31621) in MOs and TRANSFAC prediction for PU.1, both using a window of 500 pb centered by the CpG displaying significant methylation changes.
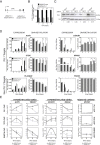
Figure 5
PU.1 has a direct role in leading DNA methylation changes at their targets. (A) Scheme depicting the two regions of the SPI1 gene (PU.1) (exon 2 and 3′UTR) targeted by the two siRNAs used in this study. (B) Effects of siRNA experiments on PU.1 levels at 1, 2, 4, and 6 days as analyzed by qRT-pCR. (C) Effects of siRNA experiments on PU.1 levels at 1, 2, 4, and 6 days as analyzed by western blot (D) Effects of PU.1 downregulation on expression and methylation of PU.1-target genes that become demethylated (ACP5, CTSK), genes that become hypermethylated (CX3CR1, NR4A2) and non-pU.1 target genes, PLA2G4E, which becomes also overexpressed and demethylated, and FSCN3, which is hypermethylated and does not undergo loss of methylation during osteoclastogenesis. (E) ChIP assays showing the effects of PU.1 downregulation in its recruitment, together with TET2 and DNMT3b binding to the same genes. Data were obtained at 0, 2, and 6 days after M-CSF /RANL stimulation. To simplify the representation negative control assays with IgG for each time point have been substracted to the experiments with each antibody. We have used the MYOD1 promoter as a negative control (data without substracting the background is presented in Additional file 10). The experiment was performed with three biological triplicates but only one experiment is shown. Error bars correspond to technical replicates. Some of them are smaller than the data point icon. T-student test was performed: * corresponds to P value <0.05; ** means P value <0.01; *** means P value <0.001.
Figure 6
Model showing a simplified diagram proposing the recruitment of TET2 and DNMT3b by PU.1 to its target genes that become hypo- or hypermethylated, respectively, during osteoclastogenesis. Genes that become hypomethylated exchange PU.1-DNMT3b by PU.1-TET2 (although whether pre-existing subpopulations of these associations may exist or, alternatively, post-translational or another mechanisms may mediate exchange of TET2 and DNMT3b; this is not elucidated at present). TDG is likely to mediate conversion of 5hmC/5fmC/5caC to demethylated cytosine. Hypermethylated genes experience an increase in the binding of DNMT3b as differentiation to OCs is triggered.
Similar articles
- 5-Hydroxymethylcytosine is an essential intermediate of active DNA demethylation processes in primary human monocytes.
Klug M, Schmidhofer S, Gebhard C, Andreesen R, Rehli M. Klug M, et al. Genome Biol. 2013 May 26;14(5):R46. doi: 10.1186/gb-2013-14-5-r46. Genome Biol. 2013. PMID: 23705593 Free PMC article. - Early de novo DNA methylation and prolonged demethylation in the muscle lineage.
Tsumagari K, Baribault C, Terragni J, Varley KE, Gertz J, Pradhan S, Badoo M, Crain CM, Song L, Crawford GE, Myers RM, Lacey M, Ehrlich M. Tsumagari K, et al. Epigenetics. 2013 Mar;8(3):317-32. doi: 10.4161/epi.23989. Epub 2013 Feb 15. Epigenetics. 2013. PMID: 23417056 Free PMC article. - Aldosterone reprograms promoter methylation to regulate αENaC transcription in the collecting duct.
Yu Z, Kong Q, Kone BC. Yu Z, et al. Am J Physiol Renal Physiol. 2013 Oct 1;305(7):F1006-13. doi: 10.1152/ajprenal.00407.2013. Epub 2013 Aug 7. Am J Physiol Renal Physiol. 2013. PMID: 23926181 Free PMC article. - Active turnover of DNA methylation during cell fate decisions.
Parry A, Rulands S, Reik W. Parry A, et al. Nat Rev Genet. 2021 Jan;22(1):59-66. doi: 10.1038/s41576-020-00287-8. Epub 2020 Oct 6. Nat Rev Genet. 2021. PMID: 33024290 Review. - DNA methylation: TET proteins-guardians of CpG islands?
Williams K, Christensen J, Helin K. Williams K, et al. EMBO Rep. 2011 Dec 23;13(1):28-35. doi: 10.1038/embor.2011.233. EMBO Rep. 2011. PMID: 22157888 Free PMC article. Review.
Cited by
- Comprehensive profiling analysis of actively resorbing osteoclasts identifies critical signaling pathways regulated by bone substrate.
Purdue PE, Crotti TN, Shen Z, Swantek J, Li J, Hill J, Hanidu A, Dimock J, Nabozny G, Goldring SR, McHugh KP. Purdue PE, et al. Sci Rep. 2014 Dec 23;4:7595. doi: 10.1038/srep07595. Sci Rep. 2014. PMID: 25534583 Free PMC article. - The HDAC7-TET2 epigenetic axis is essential during early B lymphocyte development.
Azagra A, Meler A, de Barrios O, Tomás-Daza L, Collazo O, Monterde B, Obiols M, Rovirosa L, Vila-Casadesús M, Cabrera-Pasadas M, Gusi-Vives M, Graf T, Varela I, Sardina JL, Javierre BM, Parra M. Azagra A, et al. Nucleic Acids Res. 2022 Aug 26;50(15):8471-8490. doi: 10.1093/nar/gkac619. Nucleic Acids Res. 2022. PMID: 35904805 Free PMC article. - RUNX1 regulates site specificity of DNA demethylation by recruitment of DNA demethylation machineries in hematopoietic cells.
Suzuki T, Shimizu Y, Furuhata E, Maeda S, Kishima M, Nishimura H, Enomoto S, Hayashizaki Y, Suzuki H. Suzuki T, et al. Blood Adv. 2017 Sep 6;1(20):1699-1711. doi: 10.1182/bloodadvances.2017005710. eCollection 2017 Sep 12. Blood Adv. 2017. PMID: 29296817 Free PMC article. - Tet2 and Tet3 cooperate with B-lineage transcription factors to regulate DNA modification and chromatin accessibility.
Lio CW, Zhang J, González-Avalos E, Hogan PG, Chang X, Rao A. Lio CW, et al. Elife. 2016 Nov 21;5:e18290. doi: 10.7554/eLife.18290. Elife. 2016. PMID: 27869616 Free PMC article. - TET-mediated active DNA demethylation: mechanism, function and beyond.
Wu X, Zhang Y. Wu X, et al. Nat Rev Genet. 2017 Sep;18(9):517-534. doi: 10.1038/nrg.2017.33. Epub 2017 May 30. Nat Rev Genet. 2017. PMID: 28555658 Review.
References
Publication types
MeSH terms
Substances
LinkOut - more resources
Full Text Sources
Other Literature Sources
Molecular Biology Databases
Miscellaneous


