Molecular structure of β-amyloid fibrils in Alzheimer's disease brain tissue - PubMed (original) (raw)
Molecular structure of β-amyloid fibrils in Alzheimer's disease brain tissue
Jun-Xia Lu et al. Cell. 2013.
Abstract
In vitro, β-amyloid (Aβ) peptides form polymorphic fibrils, with molecular structures that depend on growth conditions, plus various oligomeric and protofibrillar aggregates. Here, we investigate structures of human brain-derived Aβ fibrils, using seeded fibril growth from brain extract and data from solid-state nuclear magnetic resonance and electron microscopy. Experiments on tissue from two Alzheimer's disease (AD) patients with distinct clinical histories showed a single predominant 40 residue Aβ (Aβ40) fibril structure in each patient; however, the structures were different from one another. A molecular structural model developed for Aβ40 fibrils from one patient reveals features that distinguish in-vivo- from in-vitro-produced fibrils. The data suggest that fibrils in the brain may spread from a single nucleation site, that structural variations may correlate with variations in AD, and that structure-specific amyloid imaging agents may be an important future goal.
Copyright © 2013 Elsevier Inc. All rights reserved.
Figures
Fig. 1
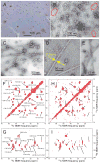
Evidence for a single predominant Aβ40 fibril structure in brain tissue of patient I. (A) Light microscope image of cortical tissue from patient I, with immunohistochemical staining for β-amyloid using monoclonal antibody 6E10. Amyloid deposits are red or pink. (B) Negatively stained TEM image of extract from occipital lobe tissue before addition of monomeric Aβ40. Fibril fragments are circled in red. (C, D) TEM images of isotopically labeled Aβ40 fibrils, recorded 24 hr after addition of monomeric Aβ40 to sonicated extract from occipital lobe tissue. Aβ40 was uniformly 15N,13C-labeled at F19, V24, G25, A30, I31, L34, and M35. (E) TEM image of fibrils prepared by seeding with sonicated extract from temporal/parietal lobe tissue. (F, G) 2D 13C-13C and 15N-13C solid state NMR spectra of Aβ40 fibrils, seeded with extract from occipital lobe tissue. Black lines and labels show site-specific crosspeak assignments. (H, I) 2D 13C-13C and 15N-13C solid state NMR spectra of Aβ40 fibrils, seeded with extract from temporal/parietal lobe tissue, with the same black lines as in panels F and H. See also Figs. S1 and S2.
Fig. 2
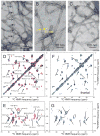
Evidence for different Aβ40 fibril structures in brain tissue of patients I and II. (A, B) TEM images of Aβ40 fibrils, recorded 36 hr after addition of monomeric Aβ40 to sonicated extract from occipital lobe tissue of patient II. Blue arrows indicate minima in the apparent fibril diameter, associated with a periodic twist that is absent from fibril images in Fig. 1. Aβ40 was uniformly 15N,13C-labeled at F19, V24, G25, S26, A30, I31, L34, and M35. (C) TEM image of fibrils prepared by seeding with sonicated extract from frontal lobe tissue of patient II. (D, E) 2D 13C-13C and 15N-13C solid state NMR spectra of Aβ40 fibrils, seeded with extract from occipital lobe tissue of patient II (blue contours) or patient I (red contours). Black lines and labels show site-specific crosspeak assignments for spectra from patient II. (F, G) 2D 13C-13C and 15N-13C solid state NMR spectra of Aβ40 fibrils, seeded with extract from frontal lobe tissue of patient II, with the same black lines as in panels D and E. See also Figs. S2 and S6.
Fig. 3
The entire Aβ40 sequence is structurally ordered in fibrils from patient I. (A, B) 2D solid state 15N-13C NMR spectra of uniformly 15N,13C-labeled Aβ40 fibrils. Panel A is a NCACX spectrum, correlating backbone 15N chemical shifts of a given residue with 13C chemical shifts of the same residue. Panel B is a NCOCX spectrum, correlating backbone 15N chemical shifts of a given residue with 13C chemical shifts of the previous residue. Only the aliphatic 13C regions are shown. Asterisks in panel B denote intra-residue crosspeaks and crosspeaks involving sidechain 15N signals. (C) 2D 13C-13C spectrum, obtained with 50 ms RAD mixing (left) and 2.94 ms fpRFDR mixing (right). Black labels indicate CO/Cα (left) and Cα/Cβ (right) crosspeaks. Blue labels indicate additional intra-residue crosspeaks, including multiple-bond crosspeaks. Site-specific crosspeak assignments in these 2D spectra show that residues 1–40 contribute relatively strong, sharp signals, implying structural order. See also Table S1.
Fig. 4
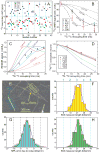
Structural restraints on Aβ40 fibrils from patient I. (A) Residue-specific secondary 13C NMR chemical shifts. Non-glycine residues with positive values for Cβ and negative values for CO and Cα are likely to have β-strand conformations. Open symbols indicate glycine residues. (B) Intermolecular 13C-13C dipole-dipole couplings among 13C-labeled methyl sites of A2 or A21 or 13C-labeled carbonyl sites of V12, F20, I31, or G38. Comparison with simulations for linear chains of 13C nuclei with various spacings indicates intermolecular distances of approximately 0.5 nm for all labeled sites, implying in-register parallel β-sheets. (C) 15N-13C dipole-dipole couplings between D23 Cγ and K28 Nζ sites indicate a 0.35 ± 0.02 nm interatomic distance, implying salt-bridge interactions between oppositely charged D23 and K28 sidechains. (D) 15N-15N dipole-dipole couplings among backbone amide nitrogens. Stronger couplings for F20 and A21 indicate non-β-strand conformations. (E) Dark-field TEM image of unstained fibrils. Mass-per-length (MPL) values are obtained from integrated intensities within 300 nm X 50 nm rectangles, centered on TMV (cyan) or Aβ40 (yellow) fibril segments, after subtraction of the average background intensity from similar rectangles on either side (dotted lines). TMV particles serve as in situ MPL standards. (F) MPL histogram, with light blue dashed lines indicating MPL values expected for structures comprised of 1–5 cross-β units. Dark blue line is a best-fit Gaussian function, centered at 28.4 ± 0.3 kDa/nm and with a full-width-at-half-maximum (FWHM) equal to 12.0 ± 0.8 kDa/nm. (G) Histogram of errors in MPL values due to noise in the dark-field images. The best-fit Gaussian function has FWHM equal to 12.8 ± 0.6 kDa/nm, showing that random noise accounts for the width in panel F. (H) MPL histogram for Aβ40 fibrils seeded with extract from occipital lobe tissue of patient II, with best-fit Gaussian function centered at 29.1 ± 1.2 kDa/nm and FWHM equal to 12.1 ± 0.8 kDa/nm. See also Fig. S3 and Table S2.
Fig. 5
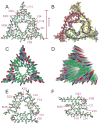
Molecular structure of Aβ40 fibrils from patient I. (A) Structure with the lowest total experimental restraint energy in Xplor-NIH calculations. The three-fold-symmetric repeat unit is shown, as viewed along the fibril growth axis. Backbone and sidechain carbon atoms are grey and green, respectively. (B) Superposition of 20 structures that are consistent with experimental restraints (PDB code 2M4J). Sidechains of the three Aβ40 molecules in the repeat unit are yellow, green, or orange. (C, D) Two views of the idealized fibril structure, created by repeating the trimeric unit 18 times with 0.48 nm displacements along the fibril axis. (E, F) Structural models for Aβ40 fibril polymorphs with three-fold and two-fold symmetry about the fibril growth axis, developed previously from solid state NMR and electron microscopy measurements on fibrils grown in vitro. Repeat units from these models are shown, calculated as regularized averages of structure bundles in PDB codes 2LMP and 2LMN, respectively. See also Figs. S4 and S6 and Tables S3 and S4.
Fig. 6
H/D exchange measurements on Aβ40 fibrils derived from occipital lobe tissue of patient I, detected through 2D 15N-13C solid state NMR spectra. (A) 2D NCA spectra of uniformly 15N,13C-labeled fibrils, before H/D exchange, after various periods of exchange, and after back-exchange. In all spectra, the highest contour level is normalized to the strongest crosspeak, and 16 contour levels are shown, decreasing by successive factors of 1.2. In the spectrum at 426–437 hr, arrows indicate positions of resolved or partially resolved crosspeaks that show clear reductions in intensity due to H/D exchange. (B) 2D NCACX spectra after various periods of exchange and after back-exchange, with contour levels as in panel A. (C) Structure from Fig. 5A with residues that exhibit significant H/D exchange colored magenta. See also Fig. S5.
Comment in
- A template for new drugs against Alzheimer's disease.
Aguzzi A, Gitler AD. Aguzzi A, et al. Cell. 2013 Sep 12;154(6):1182-4. doi: 10.1016/j.cell.2013.08.049. Cell. 2013. PMID: 24034239 - Amyloid structures from Alzheimer's disease patients.
Rienstra CM. Rienstra CM. Structure. 2013 Oct 8;21(10):1722-3. doi: 10.1016/j.str.2013.09.010. Structure. 2013. PMID: 24119671 Free PMC article.
Similar articles
- Structural variation in amyloid-β fibrils from Alzheimer's disease clinical subtypes.
Qiang W, Yau WM, Lu JX, Collinge J, Tycko R. Qiang W, et al. Nature. 2017 Jan 12;541(7636):217-221. doi: 10.1038/nature20814. Epub 2017 Jan 4. Nature. 2017. PMID: 28052060 Free PMC article. - Seeded growth of beta-amyloid fibrils from Alzheimer's brain-derived fibrils produces a distinct fibril structure.
Paravastu AK, Qahwash I, Leapman RD, Meredith SC, Tycko R. Paravastu AK, et al. Proc Natl Acad Sci U S A. 2009 May 5;106(18):7443-8. doi: 10.1073/pnas.0812033106. Epub 2009 Apr 17. Proc Natl Acad Sci U S A. 2009. PMID: 19376973 Free PMC article. - Molecular structure of a prevalent amyloid-β fibril polymorph from Alzheimer's disease brain tissue.
Ghosh U, Thurber KR, Yau WM, Tycko R. Ghosh U, et al. Proc Natl Acad Sci U S A. 2021 Jan 26;118(4):e2023089118. doi: 10.1073/pnas.2023089118. Proc Natl Acad Sci U S A. 2021. PMID: 33431654 Free PMC article. - Solid-State Structure of Abeta (Aβ) in Alzheimer's Disease.
Lu JX, Dong XQ, Zhang JJ. Lu JX, et al. Protein Pept Lett. 2017;24(4):322-330. doi: 10.2174/0929866524666170208155108. Protein Pept Lett. 2017. PMID: 28183246 Review. - Molecular structures of amyloid and prion fibrils: consensus versus controversy.
Tycko R, Wickner RB. Tycko R, et al. Acc Chem Res. 2013 Jul 16;46(7):1487-96. doi: 10.1021/ar300282r. Epub 2013 Jan 7. Acc Chem Res. 2013. PMID: 23294335 Free PMC article. Review.
Cited by
- ABTrans: A Transformer-based Model for Predicting Interaction between Anti-Aβ Antibodies and Peptides.
Su Y, Zeng X, Zhang L, Bian Y, Wang Y, Ma B. Su Y, et al. Interdiscip Sci. 2024 Oct 28. doi: 10.1007/s12539-024-00664-5. Online ahead of print. Interdiscip Sci. 2024. PMID: 39466358 - Conformations of a Low-Complexity Protein in Homogeneous and Phase-Separated Frozen Solutions.
Wilson CB, Lee M, Yau WM, Tycko R. Wilson CB, et al. bioRxiv [Preprint]. 2024 Jul 25:2024.07.25.605144. doi: 10.1101/2024.07.25.605144. bioRxiv. 2024. PMID: 39372747 Free PMC article. Updated. Preprint. - Conformational Enigma of TDP-43 Misfolding in Neurodegenerative Disorders.
Pillai M, Jha SK. Pillai M, et al. ACS Omega. 2024 Sep 20;9(39):40286-40297. doi: 10.1021/acsomega.4c04119. eCollection 2024 Oct 1. ACS Omega. 2024. PMID: 39372031 Free PMC article. Review. - Membrane-assisted Aβ40 aggregation pathways.
Muhammedkutty FNK, Zhou HX. Muhammedkutty FNK, et al. bioRxiv [Preprint]. 2024 Sep 8:2024.09.05.611426. doi: 10.1101/2024.09.05.611426. bioRxiv. 2024. PMID: 39282376 Free PMC article. Preprint. - Production of Distinct Fibrillar, Oligomeric, and Other Aggregation States from Network Models of Multibody Interaction.
Diessner EM, Thomas LJ, Butts CT. Diessner EM, et al. J Chem Theory Comput. 2024 Sep 11;20(18):7829-40. doi: 10.1021/acs.jctc.4c00916. Online ahead of print. J Chem Theory Comput. 2024. PMID: 39259851 Free PMC article.
References
- Bertini I, Gonnelli L, Luchinat C, Mao JF, Nesi A. A new structural model of Aβ40 fibrils. J Am Chem Soc. 2011;133:16013–16022. - PubMed
Publication types
MeSH terms
Substances
LinkOut - more resources
Full Text Sources
Other Literature Sources
Medical


