EGFR-mediated Beclin 1 phosphorylation in autophagy suppression, tumor progression, and tumor chemoresistance - PubMed (original) (raw)
. 2013 Sep 12;154(6):1269-84.
doi: 10.1016/j.cell.2013.08.015.
Zhongju Zou, Nils Becker, Matthew Anderson, Rhea Sumpter, Guanghua Xiao, Lisa Kinch, Prasad Koduru, Christhunesa S Christudass, Robert W Veltri, Nick V Grishin, Michael Peyton, John Minna, Govind Bhagat, Beth Levine
Affiliations
- PMID: 24034250
- PMCID: PMC3917713
- DOI: 10.1016/j.cell.2013.08.015
EGFR-mediated Beclin 1 phosphorylation in autophagy suppression, tumor progression, and tumor chemoresistance
Yongjie Wei et al. Cell. 2013.
Abstract
Cell surface growth factor receptors couple environmental cues to the regulation of cytoplasmic homeostatic processes, including autophagy, and aberrant activation of such receptors is a common feature of human malignancies. Here, we defined the molecular basis by which the epidermal growth factor receptor (EGFR) tyrosine kinase regulates autophagy. Active EGFR binds the autophagy protein Beclin 1, leading to its multisite tyrosine phosphorylation, enhanced binding to inhibitors, and decreased Beclin 1-associated VPS34 kinase activity. EGFR tyrosine kinase inhibitor (TKI) therapy disrupts Beclin 1 tyrosine phosphorylation and binding to its inhibitors and restores autophagy in non-small-cell lung carcinoma (NSCLC) cells with a TKI-sensitive EGFR mutation. In NSCLC tumor xenografts, the expression of a tyrosine phosphomimetic Beclin 1 mutant leads to reduced autophagy, enhanced tumor growth, tumor dedifferentiation, and resistance to TKI therapy. Thus, oncogenic receptor tyrosine kinases directly regulate the core autophagy machinery, which may contribute to tumor progression and chemoresistance.
Copyright © 2013 Elsevier Inc. All rights reserved.
Figures
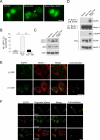
Figure 1. EGFR Activation Inhibits Autophagy and Promotes EGFR/Beclin 1 Complex Formation
(A) Representative images of GFP-LC3 puncta (autophagosomes) in A549 NSCLC cells cultured O/N in normal medium, serum-free medium, or serum-free medium plus EGF (50 ng/ml, 30 min). (B) Quantitation of GFP-LC3 puncta in conditions shown in (A). Bars are mean ± SEM of triplicate samples (≥50 cells analyzed per sample). Similar results were observed in 3 independent experiments. ***, P < 0.001, one-way ANOVA. (C) LC3-I/II and p62 western blot analysis in A549 cells in conditions shown in (A). (D) Immunoprecipitation of EGFR with Beclin 1 in A549 NSCLC cells in conditions shown in (A). (E) Colocalization of EGFR and Beclin 1 in EGF-treated A549 cells stably expressing Flag-Beclin 1 (A549/Flag-Beclin 1). Cells were cultured O/N in serum-free medium +/− EGF (50 ng/ml, 30 min), fixed, and immunostained with anti-EGFR (green) and anti-Flag to detect Flag-Beclin 1 (red). Yellow indicates colocalization. (F) Colocalization of active EGFR with cellular organelles. Cells from (E) were cultured O/N in serum-free medium + EGF (50 ng/ml, 30 min), stained with anti-EGFR and antibodies to detect early endosomes (EEA1), late endosomes/lysosomes (LAMP1) or mitochondria (Tom20). Yellow indicates colocalization. Scale bars, 20 μm. See also Figure S1.
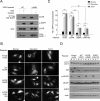
Figure 2. Active EGFR Mutants Interact with Beclin 1 and Inhibit Autophagy Independently of mTOR
(A) Immunoprecipitation of EGFR with anti-Flag in HeLa cells co-transfected with Flag-Beclin 1 and indicated EGFR plasmid. After O/N serum starvation, they were treated +/− EGF (50 ng/ml, 30 min). Cells transfected with EGFR L858R were either treated with DMSO (Erlotinib −) or (1 μM, 4 h) (Erlotinib +). (B) Representative images of GFP-LC3 puncta in HeLa cells transfected with indicated plasmid, and grown in normal medium, subjected to amino acid starvation (2 h), or treated with Torin1 (50 ng/ml, 2 h). Scale bar, 20 μm. (C) Quantification of GFP-LC3 puncta in conditions shown in (B). Bars are mean ± SEM of triplicate samples (≥50 cells analyzed per sample). Similar results were observed in 3 independent experiments. **P < 0.01, ***P < 0.001, one-way ANOVA for indicated comparison; ##P<0.01, two-way ANOVA for comparison of magnitude of changes between different groups. (D) Western blot detection of p62 and LC3-I/II (to measure autophagy) and p-4E-BP1 (to measure mTOR activity). See also Figure S2.
Figure 3. Active EGFR Mutants and EGF Ligand Stimulation of WT EGFR Alter the Beclin 1 Interactome
(A) Immunoprecipitation of indicated proteins with Beclin 1 in Hela cells transfected with indicated EGFR constructs. (B) Immunoprecipitation of Beclin 1 with Bcl-2 in HeLa cells transfected with indicated EGFR constructs. (C) Beclin 1-associated VPS34 in vitro kinase assay in anti-Beclin 1 immunoprecipitates of Hela cells transfected with indicated EGFR constructs. (D) EGF effects on the Beclin 1 interactome and Beclin 1-associated VPS34 kinase activity in A549 cells. Cells cultured as in Figure 1A were subjected to immunoprecipitation with anti-Bcl-2 followed by western blot detection of Beclin 1 or immunoprecipitation with anti-Beclin 1 followed by either western blot detection of indicated proteins or a VPS34 in vitro kinase assay. See also Figure S3.
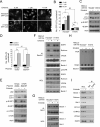
Figure 4. Erlotinib-Induced Autophagy in NSCLC Cells is Associated with Regulation of the Beclin 1 Interactome
(A) Representative images of GFP-LC3 puncta in NSCLC cell lines treated with indicated concentration of erlotinib (4 h). Scale bar, 20 μm. (B) Quantitation of GFP-LC3 puncta in NSCLC cell lines treated as in (A). Bars are mean ± SEM of triplicate samples (≥ 50 cells analyzed per sample). Similar results were observed in 3 independent experiments. (C) Western blot detection of p62, LC3-I/II, and p-4E-BP1 in indicated cells +/− erlotinib (1 μM, 2 h). (D) Quantitation of GFP-LC3 puncta in HCC827 cells transiently co-transfected with GFP-LC3 and control vector or a constitutively active mTOR mutant (S2215Y) and incubated +/− DMSO (control) or erlotinib (1 μM, 2 h). Bars are mean ± SEM of triplicate samples (≥ 50 cells analyzed per sample). Similar results were observed in 3 independent experiments. (E) Western blot detection of p62, LC3-I/II, and p-4E-BP1 in HCC827 cells treated as in (D). (F) Immunoprecipitation of indicated Beclin 1 binding partners with Beclin 1 in HCC827 and H1975 cell lines incubated +/− erlotinib (1 μM, 4 h) prior to immunoprecipitation. (G) Immunoprecipitation of Beclin 1 with Bcl-2 in the conditions in (F). (H) Beclin 1-associated VPS34 in vitro kinase assay after immunoprecipitation of Beclin 1 complexes from indicated cells +/− erlotinib (1 μM, 4 h). For (B) and (D), NS, not significant, *P < 0.05, **P < 0.01, ***P<0.001; one-way ANOVA for indicated comparison. ##P < 0.01; two-way ANOVA for comparison of magnitude of changes between different groups. See also Figure S4.
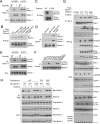
Figure 5. EGFR-Mediated Tyrosine Phosphorylation of Beclin 1 Regulates the Beclin 1 Interactome
(A) Western blot detection of Beclin 1 tyrosine phosphorylation in NSCLC cells +/− erlotinib (1 μM, 2 h). Lysates were immunoprecipitated with an anti-Beclin 1 followed by western blot analysis with an anti-phosphotyrosine antibody (pY99). (B) Beclin 1 phosphotyrosine site identification. HCC827 cells transfected with WT or indicated mutant Flag-Beclin 1 constructs were immunoprecipitated with an anti-Flag followed by western blot analysis with anti-pY99. (C) Specificity of phospho-Beclin 1 Y233 antibody. HCC827 cells transfected with WT or mutant Flag-Beclin 1 constructs were immunoprecipitated with anti-Flag followed by western blot analysis with anti-Beclin 1 pY233. (D) Western blot detection of phospho-Beclin 1 Y233 in A549 cells cultured as in Figure 3D. Lysates from same experiment were immunoprecipitated with anti-Beclin 1 followed by western blot analysis with anti-pY99 or anti-phospho-Beclin 1 Y233. (E) Western blot detection of phospho-Beclin 1 Y233 in NSCLC cells +/− erlotinib (1 μM, 4 h). Lysates were immunoprecipitated with anti-Beclin 1 followed by western blot analysis with anti phospho-Beclin 1 Y233. (F) Western blot detection of phospho-Beclin 1 Y233 in NSCLC cell lines with or without active EGFR mutations. Phospho-Beclin 1 Y233 was detected as in (E). See text for information on cell lines. (G) Immunoprecipitation of Beclin 1 binding partners with WT and indicated Flag-Beclin 1 mutant constructs in stably transfected HCC827 cells +/− erlotinib (1 μM, 2 h). Lysates were immunoprecipitated with anti-Bcl-2 or anti-Flag and subjected to western blot analysis with indicated antibodies. Beclin 1 immunoprecipitates were also used to measure Beclin 1-associated VPS34 in vitro kinase activity (lower panel). (H) Effect of Beclin 1 tyrosine phosphorylation site mutations on EGFR-regulated Beclin 1 dimerization and binding to Rubicon. Immunoprecipitation with anti-Flag and western blot analysis with indicated antibodies of HCC827 cells co-transfected with indicated Flag epitope-tagged Beclin 1 constructs and Myc epitope-tagged Beclin 1 constructs +/− erlotinib (1 μM, 2 h). WT, wild-type Flag-Beclin 1; FFF, Flag-Beclin 1 Y229F/Y233F/Y352F; Flag-Beclin 1 Y229E/Y233E/Y352E. See also Figure S5.
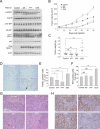
Figure 6. Beclin 1 Tyrosine Phosphorylation is Associated with Enhanced Tumorigenesis in vivo
(A) Western blot analysis of autophagy (p62 and LC3), EGFR activity (p-EGFR) and mTOR activity (p-4E-BP1) in indicated xenografts (3 randomly chosen samples per condition; similar results observed in all 10 samples per condition). (B) Tumor volume of xenografts formed after subcutaneous injection of NOD SCID® mice with HCC827 cells stably transfected with indicated Beclin 1 constructs. Results are mean volume ± SEM for 10 mice per group per time point. P<0.0001 for EEE vs. control; _P_=0.0006 for WT vs. control; _P_=0.0074 for FFF vs. control; linear-mixed effect model. (C) Tumor weights from experiment in (B) upon autopsy at day 35. (D) Representative images of TUNEL-labeling of indicated HCC827 xenograft tumor genotype. Black arrow denotes representative TUNEL-positive cell. (E-F) Quantitation of TUNEL-positive nuclei (E) and Ki67-positive nuclei (F) in indicated xenograft tumor genotype. Bars are mean + SEM for all tumors in each genotype (10 per group), from 30 randomly selected fields for each tumor. (G) Representative H & E images of indicated HCC827 xenograft tumor genotypes. See text for description. (H) Representative images of TTF-1 immunostaining in indicated HCC827 xenograft tumor genotype. For (C), (E), (F), NS, not significant, *P < 0.05, **P < 0.01, ***P<0.001; one-way ANOVA. Scale bars, 20 μm. See also Figure S6.
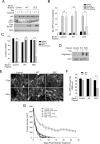
Figure 7. Beclin 1 Tyrosine Phosphorylation Leads to Erlotinib Resistance in NSCLC Xenografts
(A) Western blot detection of Flag-Beclin 1, p62 and LC3-I/II in indicated HCC827/GFP-LC3 cells with doxycycline-inducible expression of WT Beclin 1 or Beclin 1 Y229E/Y233E/Y352E (EEE). Cells were incubated in +/− doxycycline (1 μg ml−1, 4 days) to induce Flag-Beclin 1 expression and then treated +/− erlotinib (0.2 μM, 2 h). (B) Quantification of GFP-LC3 puncta for cells treated as in (A). Bars are mean ± SEM of triplicate samples (≥50 cells analyzed per sample). Similar results were observed in 3 independent experiments. (C) Clonogenic survival of indicated HCC827/GFP-LC3/Beclin 1 cell lines grown +/− erlotinib (0.2 μM, 14 days). Beclin 1 expression was induced by doxycycline (1 μg ml−1, 4 days) prior to erlotinib treatment. Bars are mean ± SEM of triplicate wells per treatment condition. Similar results were observed in 3 independent experiments. (D) Effect of doxycycline treatment of mice on expression of indicated Flag-Beclin 1 constructs in tumor xenografts. Shown are western blot analyses of tumors 3 days after doxycycline or control treatment. (E) Representative images of GFP-LC3 staining in indicated NSCLC xenografts treated with 12.5 mg kg−1 erlotinib for 1 day. Scale bar, 20 μm. (F) Quantitation of number of GFP-LC3 dots per unit area of xenograft. Bars are mean ± SEM for 3 mice per genotype, with 50 randomly selected fields for each tumor. (G) Effect of erlotinib on tumor response of xenografts formed by indicated HCC827/GFP-LC3/Beclin 1 cell lines. Mice bearing HCC827/GFP-LC3/Beclin 1 xenografts were treated with or without doxycline for 3 days to induce Flag-Beclin 1 expression when the tumor volume reached ~400 mm3, and then treated with 12.5 mg kg−1 erlotinib daily. Values are mean tumor volume ± SEM per time point for 9-10 mice per group. P<0.0001 for EEE vs. EEE+dox; NS for WT vs. WT+dox and FFF vs. FFF+dox; linear-mixed effect model. For (B), (C), (F), NS, not significant, **P < 0.01, ***P<0.001; one-way ANOVA. See also Figure S7.
Comment in
- Self-eating limits EGFR-dependent tumor growth.
Fantin VR, Abraham RT. Fantin VR, et al. Cell. 2013 Sep 12;154(6):1184-6. doi: 10.1016/j.cell.2013.08.040. Cell. 2013. PMID: 24034240
Similar articles
- PAQR3 suppresses the growth of non-small cell lung cancer cells via modulation of EGFR-mediated autophagy.
Cao Q, You X, Xu L, Wang L, Chen Y. Cao Q, et al. Autophagy. 2020 Jul;16(7):1236-1247. doi: 10.1080/15548627.2019.1659654. Epub 2019 Aug 30. Autophagy. 2020. PMID: 31448672 Free PMC article. - Erlotinib-induced autophagy in epidermal growth factor receptor mutated non-small cell lung cancer.
Li YY, Lam SK, Mak JC, Zheng CY, Ho JC. Li YY, et al. Lung Cancer. 2013 Sep;81(3):354-361. doi: 10.1016/j.lungcan.2013.05.012. Epub 2013 Jun 13. Lung Cancer. 2013. PMID: 23769318 - Regulation of epidermal growth factor receptor tyrosine kinase inhibitor resistance via Ambra1-mediated autophagy in non-small cell lung cancer.
Chen YH, Yang Y, Xu LJ, Deng Y, Fu JW. Chen YH, et al. J Physiol Pharmacol. 2023 Jun;74(3). doi: 10.26402/jpp.2023.3.07. Epub 2023 Aug 30. J Physiol Pharmacol. 2023. PMID: 37661184 - Impaired autophagy and APP processing in Alzheimer's disease: The potential role of Beclin 1 interactome.
Salminen A, Kaarniranta K, Kauppinen A, Ojala J, Haapasalo A, Soininen H, Hiltunen M. Salminen A, et al. Prog Neurobiol. 2013 Jul-Aug;106-107:33-54. doi: 10.1016/j.pneurobio.2013.06.002. Epub 2013 Jul 1. Prog Neurobiol. 2013. PMID: 23827971 Review. - Epidermal Growth Factor Receptor (EGFR) Pathway, Yes-Associated Protein (YAP) and the Regulation of Programmed Death-Ligand 1 (PD-L1) in Non-Small Cell Lung Cancer (NSCLC).
Hsu PC, Jablons DM, Yang CT, You L. Hsu PC, et al. Int J Mol Sci. 2019 Aug 5;20(15):3821. doi: 10.3390/ijms20153821. Int J Mol Sci. 2019. PMID: 31387256 Free PMC article. Review.
Cited by
- Doxazosin, a Classic Alpha 1-Adrenoceptor Antagonist, Overcomes Osimertinib Resistance in Cancer Cells via the Upregulation of Autophagy as Drug Repurposing.
Suzuki S, Yamamoto M, Sanomachi T, Togashi K, Sugai A, Seino S, Okada M, Yoshioka T, Kitanaka C. Suzuki S, et al. Biomedicines. 2020 Aug 5;8(8):273. doi: 10.3390/biomedicines8080273. Biomedicines. 2020. PMID: 32764319 Free PMC article. - Beclin 1 regulates growth factor receptor signaling in breast cancer.
Rohatgi RA, Janusis J, Leonard D, Bellvé KD, Fogarty KE, Baehrecke EH, Corvera S, Shaw LM. Rohatgi RA, et al. Oncogene. 2015 Oct 16;34(42):5352-62. doi: 10.1038/onc.2014.454. Epub 2015 Feb 2. Oncogene. 2015. PMID: 25639875 Free PMC article. - Differential protein stability of EGFR mutants determines responsiveness to tyrosine kinase inhibitors.
Ray P, Tan YS, Somnay V, Mehta R, Sitto M, Ahsan A, Nyati S, Naughton JP, Bridges A, Zhao L, Rehemtulla A, Lawrence TS, Ray D, Nyati MK. Ray P, et al. Oncotarget. 2016 Oct 18;7(42):68597-68613. doi: 10.18632/oncotarget.11860. Oncotarget. 2016. PMID: 27612423 Free PMC article. - Role and mechanism of action of LAPTM4B in EGFR-mediated autophagy.
Ji X, Ma H, Du Y. Ji X, et al. Oncol Lett. 2022 Apr;23(4):109. doi: 10.3892/ol.2022.13229. Epub 2022 Feb 7. Oncol Lett. 2022. PMID: 35242237 Free PMC article. Review. - The multifaceted role of autophagy in cancer and the microenvironment.
Folkerts H, Hilgendorf S, Vellenga E, Bremer E, Wiersma VR. Folkerts H, et al. Med Res Rev. 2019 Mar;39(2):517-560. doi: 10.1002/med.21531. Epub 2018 Oct 9. Med Res Rev. 2019. PMID: 30302772 Free PMC article. Review.
References
- Botti J, Djavaheri-Mergny M, Pilatte Y, Codogno P. Autophagy signaling and the cogwheels of cancer. Autophagy. 2006;2:67–73. - PubMed
- Carpenter G. Receptors for epidermal growth factor and other polypeptide mitogens. Annu. Rev. Biochem. 1987;56:881–914. - PubMed
- Ciardiello F, Tortora G. EGFR antagonists in cancer treatment. N. Engl. J. Med. 2008;358:1160–1174. - PubMed
Publication types
MeSH terms
Substances
Grants and funding
- R01 109618/PHS HHS/United States
- R01 CA084254/CA/NCI NIH HHS/United States
- P50CA70907/CA/NCI NIH HHS/United States
- P50 CA070907/CA/NCI NIH HHS/United States
- R01 CA109618/CA/NCI NIH HHS/United States
- R01 84254/PHS HHS/United States
LinkOut - more resources
Full Text Sources
Other Literature Sources
Molecular Biology Databases
Research Materials
Miscellaneous
