Mapping cellular hierarchy by single-cell analysis of the cell surface repertoire - PubMed (original) (raw)
. 2013 Oct 3;13(4):492-505.
doi: 10.1016/j.stem.2013.07.017. Epub 2013 Sep 12.
Sidinh Luc, Eugenio Marco, Ta-Wei Lin, Cong Peng, Marc A Kerenyi, Semir Beyaz, Woojin Kim, Jian Xu, Partha Pratim Das, Tobias Neff, Keyong Zou, Guo-Cheng Yuan, Stuart H Orkin
Affiliations
- PMID: 24035353
- PMCID: PMC3845089
- DOI: 10.1016/j.stem.2013.07.017
Mapping cellular hierarchy by single-cell analysis of the cell surface repertoire
Guoji Guo et al. Cell Stem Cell. 2013.
Abstract
Stem cell differentiation pathways are most often studied at the population level, whereas critical decisions are executed at the level of single cells. We have established a highly multiplexed, quantitative PCR assay to profile in an unbiased manner a panel of all commonly used cell surface markers (280 genes) from individual cells. With this method, we analyzed over 1,500 single cells throughout the mouse hematopoietic system and illustrate its utility for revealing important biological insights. The comprehensive single cell data set permits mapping of the mouse hematopoietic stem cell differentiation hierarchy by computational lineage progression analysis. Further profiling of 180 intracellular regulators enabled construction of a genetic network to assign the earliest differentiation event during hematopoietic lineage specification. Analysis of acute myeloid leukemia elicited by MLL-AF9 uncovered a distinct cellular hierarchy containing two independent self-renewing lineages with different clonal activities. The strategy has broad applicability in other cellular systems.
Copyright © 2013 Elsevier Inc. All rights reserved.
Conflict of interest statement
The authors declare no conflict of interest.
Figures
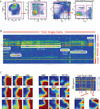
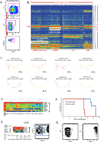
Figure 1. Single cell gene expression analysis of the cell surface repertoire
(A) Flow chart of single cell assay development. (B) A heatmap showing that the unbiased hierarchical clustering well separates single cell gene expression signatures from different type of adult stem cells. Each row corresponds to a specific gene; each column corresponds to a particular single cell. Red to yellow suggest high to middle expression, while green to blue suggest low to no expression. (C) A heatmap highlighting examples of lineage specific markers from Figure 1B. The color scale and sample layout are the same as in Figure 1B. See also Figure S1.
Figure 2. Comprehensive single cell analysis of the mouse hematopoietic system
(A) Single cell sorting strategy to enrich stem and progenitor cells but to cover all possible populations. (B) A master heatmap showing the hierarchical clustering of gene expression signatures from 1500 single cells throughout the hematopoietic system. Each row corresponds to a specific gene; each column corresponds to a particular single cell. Strong correlation between gene and cell clusters are highlighted by white boxes and labeled by cell type specific clusters. Red to yellow suggest high to middle expression, while green to blue suggest low to no expression. (C) GEDI plot allows for visualization of single cell global signatures. Examples of single cell GEDI map from different cell types are presented. Color scale is as described in Figure 1B. The lower right corner, which is always red, corresponds to endogenous control genes that are highly expressed in all single cell samples. From the Lin-Sca1+Kit- population, there are cluster of single cells (The red lines separate different clusters in the heatmap of Lin-Sca1+Kit- single cell data) with Nuocyte signature and PDC signature. See also Figure S2.
Figure 3. Dissection of heterogeneity within classical progenitor types
(A)–(D) Top 4 most variable genes are listed according to their standard deviation value within a particular progenitor cell type. The hierarchical clustering heatmap and violin density plot reveal the heterogeneity in the population. The percentages of cells with positive expression levels are marked on the violin plot. Color scale is as described in Figure 1B. FACS analysis confirms gene expression differences at protein level. (E) Violin plots showing the expression pattern of top 4 most variable genes in MEP, ETP and CDP progenitor populations. See also Figure S3.
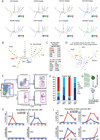
Figure 4. Mapping cellular hierarchy by lineage progression analysis
(A) Spanning-tree progression analysis of density-normalized events from single cell expression pattern of 40 gene clusters. The information regarding each clusters is listed in Table S3. Overlaid expression pattern of different gene clusters helped to define distinct cell lineages. Color scale is as described in Figure 1B. (B) Single cell SPADE hierarchy suggests early separation of MegE lineage and lymphomyeloid lineage. (C) CD55 is the most differentially expressed MegE cell surface marker between the CMP1 and CMP2. In addition, CD55 is highly correlated with Gata1 expression across the single cell data set. (D) SPADE analysis of FACS data from mouse bone marrow stained with CD55, CD150, CD34, CD16/32, Sca1, Kit and lineage antibodies. Only Lin-Kit+ (as defined by Lineage Signal <1000, Kit Signal>1000) data points are included in the analysis to reduce complexity. The two cell cluster nodes that contain most of the HSCs (as defined by CD150 Signal > 1000, CD48 Signal < 1000, CD34 Signal < 1000, Sca1 Signal > 1000) containing nodes are labeled in red. The two nodes are closely related with MegE branch as defined by overlaid expression in Figure S4C. (E) CD55 can be used to separate both CMP and MPP progenitors. (F) In vitro colony forming assays using EPO containing methylcellulose suggest that CD55 divides both CMP and MPP into functionally different subpopulations. 150 cells from each population were plated in 1.5mL of Methocult M3434 (Stem Cell Technologies) in duplicates. E: Erythrocytes; M: Megakaryocytes; m: monocytes; n: neutrophils. (G)-(I) Reconstitution experiment using Actβ GFP mice validated the early separation of MegE lineage potential and lymphomyeloid potential in vivo. X-axes corresponds to sampling time. Y-axes corresponds to GFP% of the total reconstituted cells. Mice are irradiated by two doses of 5 Gy with a 4 hours interval. Data are represented as mean of 4 biological replicates for each group. Error Bars correspond to standard deviation. See also Figure S4.
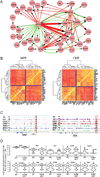
Figure 5. Genetic regulation during HSC differentiation
(A) A genetic network constructed by Cytoscape using transcription factor ChIP-seq binding information and single cell level gene expression correlation data. It highlights transcription factors components within the complete network in Figure S5A. Green arrow corresponds to positive correlation, while red arrow corresponds to anti correlation. The width of the line corresponds to absolute value of the covariance between two linked gene nodes. (B) Gene to gene correlation heatmaps containing HSC, MegE, Myeloid and Lymphoid modules in MPP and CMP. (C) HSC module transcription factors co-occupy Gata1 and Gfi1b upstream region. (D) Gene expression level distribution of LSK single cells from wildtype and Gata2 heterozygous mice are presented with violin density plots. The percentages of cells with positive expression levels are marked on the violin plots. Note the decrease in MegE primed cells (Gfi1b+ or Gata1+) cells and increase in lymphomyeloid primed cells (Cebpa+, Flt3+, CD53+ or Sell+) in the Gata2 +/− LSK population. See also Figure S5.
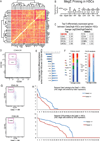
Figure 6. MegE lineage priming in HSCs
(A) Gene to gene correlation heatmaps reveals correlation of MegE lineage markers in single cells from HSCs (CD48-CD34-CD150+LSK). (B) Violin plot suggests significant MegE lineage priming in HSCs (CD48-CD34-CD150+LSK). (C) CD150 stands out as the top differentially expressed gene between Gata2high HSCs and Gata2int HSCs. (D) FACS sorting of CD150high and CD150int HSCs. (E) Gene expression difference between the sorted CD150high versus CD150int HSCs. (F) In vitro colony forming assays using Methocult M3434 (Stem Cell Technologies) suggest that CD150high HSCs produce more MegE lineage containing colonies than the CD150int HSCs. FACS analysis of day7 methylcellulose cultures also suggests a decreased percentage of CD11b+ or Gr1+ myeloid cells generated from the CD150high HSCs when compared to CD150int HSCs. CD11b- and Gr1- cells were defined as non-myeloid cells. (G) Gata2 haploinsufficiency results in a reduction of CD150high HSCs. Three animals were analyzed for each genotype; results are shown as mean±SD. (H) Gata2 haploinsufficency results in a reduction of Gata1 and Gfi1b priming in the HSC compartment. A total of 87 single cells were analyzed for each genotype. Single cells are ordered by Gata1 or Gfi1b expression. See also Figure S6.
Figure 7. Single cell analysis of the AML cellular hierarchy
(A) Single cell sorting strategy for different leukemia compartments in the MLL-AF9 AML mouse model. (B) A heatmap showing hierarchical clustering of gene expression signatures from 390 single cells from wildtype myeloid cells (Lin-Il7r-Kit+Sca1- CD34+CD16/32+ or Lin+ bone marrow) and MLL-AF9 primary leukemia cells (Lin-Il7r-Kit+Sca1-CD34+CD16/32+ or Lin+ bone marrow). Each row corresponds to a specific gene; each column corresponds to a particular single cell. White boxes highlight strongly correlated gene and cell clusters. Color scale is as described in Figure 1B. (C) SPADE analysis of the wildtype myeloid hierarchy and leukemia hierarchy using the high dimensional single cell data. Overlaid expression pattern of different gene clusters helped to define distinct cell lineages in the MLL-AF9 leukemia system. (D) Gene expression clustering heatmap of gene expression from the main leukemia cell clusters and all the main hematopoietic cell clusters reveals distinct leukemia specific expression. (E) Dissection of heterogeneity in the LGMP (Lin-Il7r-Kit+Sca1-CD34+CD16/32+) according to described method in Figure 3. (F) Survival of secondary recipient mice receiving 800 CD24+ LGMP or CD24-LGMP cells. (G) Reconstitution of two leukemia lineages in the secondary recipient bone marrow. See also Figure S7.
Similar articles
- Exploring the contribution of Zfp521/ZNF521 on primary hematopoietic stem/progenitor cells and leukemia progression.
Chiarella E. Chiarella E. Cell Tissue Res. 2024 Dec;398(3):161-173. doi: 10.1007/s00441-024-03926-2. Epub 2024 Oct 22. Cell Tissue Res. 2024. PMID: 39436449 Free PMC article. Review. - Single-Cell Gene Expression Analyses Reveal Distinct Self-Renewing and Proliferating Subsets in the Leukemia Stem Cell Compartment in Acute Myeloid Leukemia.
Sachs K, Sarver AL, Noble-Orcutt KE, LaRue RS, Antony ML, Chang D, Lee Y, Navis CM, Hillesheim AL, Nykaza IR, Ha NA, Hansen CJ, Karadag FK, Bergerson RJ, Verneris MR, Meredith MM, Schomaker ML, Linden MA, Myers CL, Largaespada DA, Sachs Z. Sachs K, et al. Cancer Res. 2020 Feb 1;80(3):458-470. doi: 10.1158/0008-5472.CAN-18-2932. Epub 2019 Nov 29. Cancer Res. 2020. PMID: 31784425 Free PMC article. - Identification and characterization of leukemia stem cells in murine MLL-AF9 acute myeloid leukemia.
Somervaille TC, Cleary ML. Somervaille TC, et al. Cancer Cell. 2006 Oct;10(4):257-68. doi: 10.1016/j.ccr.2006.08.020. Cancer Cell. 2006. PMID: 17045204 - A Myc enhancer cluster regulates normal and leukaemic haematopoietic stem cell hierarchies.
Bahr C, von Paleske L, Uslu VV, Remeseiro S, Takayama N, Ng SW, Murison A, Langenfeld K, Petretich M, Scognamiglio R, Zeisberger P, Benk AS, Amit I, Zandstra PW, Lupien M, Dick JE, Trumpp A, Spitz F. Bahr C, et al. Nature. 2018 Jan 25;553(7689):515-520. doi: 10.1038/nature25193. Epub 2018 Jan 17. Nature. 2018. PMID: 29342133 - Advancing haematopoietic stem and progenitor cell biology through single-cell profiling.
Hamey FK, Nestorowa S, Wilson NK, Göttgens B. Hamey FK, et al. FEBS Lett. 2016 Nov;590(22):4052-4067. doi: 10.1002/1873-3468.12231. Epub 2016 Jun 21. FEBS Lett. 2016. PMID: 27259698 Review.
Cited by
- Single-cell transcriptional analysis of normal, aberrant, and malignant hematopoiesis in zebrafish.
Moore FE, Garcia EG, Lobbardi R, Jain E, Tang Q, Moore JC, Cortes M, Molodtsov A, Kasheta M, Luo CC, Garcia AJ, Mylvaganam R, Yoder JA, Blackburn JS, Sadreyev RI, Ceol CJ, North TE, Langenau DM. Moore FE, et al. J Exp Med. 2016 May 30;213(6):979-92. doi: 10.1084/jem.20152013. Epub 2016 May 2. J Exp Med. 2016. PMID: 27139488 Free PMC article. - The Pleiotropic Effects of GATA1 and KLF1 in Physiological Erythropoiesis and in Dyserythropoietic Disorders.
Barbarani G, Fugazza C, Strouboulis J, Ronchi AE. Barbarani G, et al. Front Physiol. 2019 Feb 12;10:91. doi: 10.3389/fphys.2019.00091. eCollection 2019. Front Physiol. 2019. PMID: 30809156 Free PMC article. Review. - New genetic tools for the in vivo study of hematopoietic stem cell function.
Upadhaya S, Reizis B, Sawai CM. Upadhaya S, et al. Exp Hematol. 2018 May;61:26-35. doi: 10.1016/j.exphem.2018.02.004. Epub 2018 Mar 6. Exp Hematol. 2018. PMID: 29501466 Free PMC article. Review. - In vivo single cell analysis reveals Gata2 dynamics in cells transitioning to hematopoietic fate.
Eich C, Arlt J, Vink CS, Solaimani Kartalaei P, Kaimakis P, Mariani SA, van der Linden R, van Cappellen WA, Dzierzak E. Eich C, et al. J Exp Med. 2018 Jan 2;215(1):233-248. doi: 10.1084/jem.20170807. Epub 2017 Dec 7. J Exp Med. 2018. PMID: 29217535 Free PMC article. - Construction of developmental lineage relationships in the mouse mammary gland by single-cell RNA profiling.
Pal B, Chen Y, Vaillant F, Jamieson P, Gordon L, Rios AC, Wilcox S, Fu N, Liu KH, Jackling FC, Davis MJ, Lindeman GJ, Smyth GK, Visvader JE. Pal B, et al. Nat Commun. 2017 Nov 20;8(1):1627. doi: 10.1038/s41467-017-01560-x. Nat Commun. 2017. PMID: 29158510 Free PMC article.
References
- Adolfsson J, Mansson R, Buza-Vidas N, Hultquist A, Liuba K, Jensen CT, Bryder D, Yang L, Borge OJ, Thoren LA, et al. Identification of Flt3+ lympho-myeloid stem cells lacking erythro-megakaryocytic potential a revised road map for adult blood lineage commitment. Cell. 2005;121:295–306. - PubMed
- Akashi K, Traver D, Miyamoto T, Weissman IL. A clonogenic common myeloid progenitor that gives rise to all myeloid lineages. Nature. 2000;404:193–197. - PubMed
- Arinobu Y, Mizuno S, Chong Y, Shigematsu H, Iino T, Iwasaki H, Graf T, Mayfield R, Chan S, Kastner P, et al. Reciprocal activation of GATA-1 and PU.1 marks initial specification of hematopoietic stem cells into myeloerythroid and myelolymphoid lineages. Cell Stem Cell. 2007;1:416–427. - PubMed
- Bonnet D, Dick JE. Human acute myeloid leukemia is organized as a hierarchy that originates from a primitive hematopoietic cell. Nat Med. 1997;3:730–737. - PubMed
Publication types
MeSH terms
Substances
Grants and funding
- U01 HL100001/HL/NHLBI NIH HHS/United States
- HHMI/Howard Hughes Medical Institute/United States
- K01 DK093543/DK/NIDDK NIH HHS/United States
- K08 CA154777/CA/NCI NIH HHS/United States
- P30 DK049216/DK/NIDDK NIH HHS/United States
LinkOut - more resources
Full Text Sources
Other Literature Sources

