Detection of magnetic field intensity gradient by homing pigeons (Columba livia) in a novel "virtual magnetic map" conditioning paradigm - PubMed (original) (raw)
Detection of magnetic field intensity gradient by homing pigeons (Columba livia) in a novel "virtual magnetic map" conditioning paradigm
Cordula V Mora et al. PLoS One. 2013.
Abstract
It has long been thought that birds may use the Earth's magnetic field not only as a compass for direction finding, but that it could also provide spatial information for position determination analogous to a map during navigation. Since magnetic field intensity varies systematically with latitude and theoretically could also provide longitudinal information during position determination, birds using a magnetic map should be able to discriminate magnetic field intensity cues in the laboratory. Here we demonstrate a novel behavioural paradigm requiring homing pigeons to identify the direction of a magnetic field intensity gradient in a "virtual magnetic map" during a spatial conditioning task. Not only were the pigeons able to detect the direction of the intensity gradient, but they were even able to discriminate upward versus downward movement on the gradient by differentiating between increasing and decreasing intensity values. Furthermore, the pigeons typically spent more than half of the 15 second sampling period in front of the feeder associated with the rewarded gradient direction indicating that they required only several seconds to make the correct choice. Our results therefore demonstrate for the first time that pigeons not only can detect the presence and absence of magnetic anomalies, as previous studies had shown, but are even able to detect and respond to changes in magnetic field intensity alone, including the directionality of such changes, in the context of spatial orientation within an experimental arena. This opens up the possibility for systematic and detailed studies of how pigeons could use magnetic intensity cues during position determination as well as how intensity is perceived and where it is processed in the brain.
Conflict of interest statement
Competing Interests: The authors have declared that no competing interests exist.
Figures
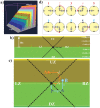
Figure 1. Experimental setup for virtual magnetic map conditioning paradigm (not drawn to scale).
a) Circular orientation arena (diameter 110 cm) surrounded by three-axis coils system (red lines; adapted from [24]), which generated a spatially uniform magnetic field intensity cue throughout the entire arena. This type of magnetic cue is in contrast to spatially variable magnetic anomalies used by past conditioning studies (e.g., [17]). Magnetic field intensity in the arena was controlled in real time via customized MVR (Magnetic Virtual Reality) software based on the position of the pigeon over time within a virtual magnetic intensity map. Note that the arena's four feeders-response units are not shown for clarity. b) Pigeon walking in arena whilst attached via harness (red) to horizontal tracker arm (adapted from previous sea turtle studies [23]), with tracker arm orientation in the arena detected by angular decoder every 200 ms. Note that the arena's four feeders-response units are not shown for clarity. c) Top view of arena showing pigeon attached to horizontal tracker arm as well as position of four feeder-response units (grey rectangles), each with a pecking key above an automated food reservoir, located around the periphery of the circular arena in the four cardinal directions (geographic North, South, East and West; dashed lines).
Figure 2. Virtual magnetic intensity map (VMI-map) and generation of individual tracks by pigeons inside this map.
a) Angled side view of VMI-map consisting of simple slope of steadily increasing magnetic intensity with inclination and declination held constant at background level. This map does not represent a spatial gradient within the arena from one side to the other, but rather a dynamic virtual environment comparable to that presented visually to players of first-person-perspective computer games whilst moving through virtual environments (see main text for more details). Note that coloured bands on the map do not represent a step-wise increase in magnetic intensity, but were only used to aid visual comparison of a pigeon's tracks during a session. Orientation of gradient direction within the experimental room (i.e., which one of the four feeders was associated with upward-gradient movement) was based on a pseudo-random schedule for each trial. Pigeon was “released” at the start of the trial in the center of the VMI-map (black dot) and magnetic field intensity changes experienced within a 15-s trial were limited in this study to an area of less than ±15,000 nT (red dashed line; enlarged in Figure 2b). b) Enlarged section of VMI-map showing operational range for this study. When the pigeon faced the feeder associated with either the up- or down-gradient movement in map, magnetic intensity change occurred at a maximum speed of 833 nT per second with one coloured band being crossed in 18 seconds. Thus, the maximum increase or decrease in intensity experienced for a 15-s trial, achieved by the pigeon sitting in front of either of the feeders associated with magnetic intensity increases or decreases respectively, was ±12,500 nT. Point of the pigeon's “release” at the start of the 15-s trial (small black circle) and subdivision (black dashed lines) of map into four zones (up-gradient zone (UZ), down-gradient zone (DZ), left-side zone (LZ), and right-side zone (RZ)) are shown. c) Frontal view of VMI-map with two simulated tracks (red and blue lines). During a trial, the pigeon was “released” in the center of the map (small black circle) and its path in the VMI-map plotted in real time as a track. Note that magnetic field intensity was adjusted in real time uniformly throughout the entire arena based on the pigeon's current track position within the virtual map. That is, as the track was plotted in the map based on which direction in the arena the pigeon's tracker arm faced over time, the pigeon was exposed to the magnetic field intensity in accordance with its current position in the VMI-map. Sitting still in front of a feeder resulted in straight track lines, while movement between feeders resulted in angular or curved track lines depending on the speed of rotation by the pigeon. At the end of a 15 s sampling period the pigeon was allowed to choose one feeder by pecking that feeder's illuminated pecking key with only responses at the feeder associated with either up-gradient movement (up-gradient group) or down-slope movement (down-gradient group) as indicated by increasing or decreasing intensity, respectively, being rewarded with food. Each tracks terminal point at the end of the 15-s sampling period was scored to fall into one of four zones (see above). For the red track the up-gradient orientation was associated with the North feeder and for the blue track with the East feeder. Numbers next to each track identify the differently coloured track segments linked with the pigeon's orientation in the arena in Figure 2d. Note that while the red track terminated at the end of the 15-s trial at “A” in the up-gradient zone, the pigeon had switched for its final response to a feeder associated with sideways movement in the map, and thus its choice was unrewarded. The blue track terminated at “B” in the right-side zone, but the pigeon had switched for its final choice to the feeder associated with up-gradient movement (increasing intensity) in the map. Such a choice would have been rewarded for a bird in the up-gradient group, but not the down-gradient group. d) Diagrams illustrating the pigeon's position or movement between positions (red arrow) in the arena for the time of the red (top row) and blue (bottom row) track's individual segments seen in Figure 2c. The four feeder-response units are shown as grey rectangles.
Figure 3. Magnetic field intensity experienced by a pigeon over the course of a trial's 15-s sampling period.
Shown are intensities for red (left) and blue (right) track segments seen in Figure 2c.
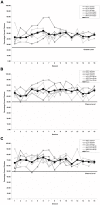
Figure 4. Mean percentage of correct choices made by individual pigeons during each session of the initial conditioning series.
a) Mean percentage of correct choices for the two groups, for which rewarded feeder choices were either associated with increasing (up-gradient) or decreasing (down-gradient) intensity changes (chance level 25%). Because of extensive pre-training exposure to the reinforcement contingencies (see text), there was no evidence for gradual response acquisition typically associated with the learning of a discrimination task. b) Combined mean percentage of choices made at either feeder associated with the intensity gradient of the virtual magnetic intensity (VMI) map (note chance level of 50%). c) Mean percentage of correct choices calculated only for trials during which the pigeons chose either of the two feeders associated with the direction of the intensity gradient of the virtual magnetic intensity (VMI) map (chance level of 50%).
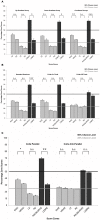
Figure 5. Mean percentage of zone scores with standard error bars showing in which VMI-map zone each trial's track terminated at the end of 15 s sampling period.
a) Initial conditioning series for which pigeons were divided into groups as to whether feeder choices associated with increasing (up-gradient) or decreasing (down-gradient) intensity changes were rewarded (chance level 25%). b) Coils on-off series consisting of standard sessions as well as control sessions for which half of the trials had normal current input to the magnetic coil system and the other half had no current input based on a pseudorandom schedule. Non-significance does not imply random discrimination performance as this score relates to the amount of time spent at each feeder during the 15-second sampling period, which may be different from final feeder choice (see also Figure 2c). c) Parallel-anti-parallel series for which sessions with current running parallel through a double-wound coil system were alternated with sessions with current running anti-parallel. For abbreviations see Figure 4 except: UZ = Up gradient zone, DZ = Down gradient zone, LZ = Left gradient zone, RZ = Right gradient zone, RWZ = rewarded gradient zone (UZ or DZ for up-gradient and down-gradient groups respectively) and URWZ = unrewarded gradient zone (DZ or UZ for up-gradient and down-gradient groups respectively). Levels of significance: n.s. = not significant, * = 0.05; ** = 0.01; and *** = 0.001.
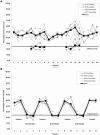
Figure 6. Mean percentage of correct choices made by individual pigeons during each control series.
a) Coils on-off series consisting of standard sessions as well as control sessions for which half of the trials had normal current input to the magnetic coil system (solid symbols with solid lines) and the other half had no current input based on a pseudorandom schedule (solid symbols with dashes lines). b) Parallel-anti-parallel series for which sessions with current running parallel through a double-wound coil system were alternated with sessions with current running anti-parallel.
Similar articles
- Conditioned discrimination of magnetic inclination in a spatial-orientation arena task by homing pigeons (Columba livia).
Mora CV, Acerbi ML, Bingman VP. Mora CV, et al. J Exp Biol. 2014 Dec 1;217(Pt 23):4123-31. doi: 10.1242/jeb.101113. Epub 2014 Oct 2. J Exp Biol. 2014. PMID: 25278470 - Evidence that pigeons orient to geomagnetic intensity during homing.
Dennis TE, Rayner MJ, Walker MM. Dennis TE, et al. Proc Biol Sci. 2007 May 7;274(1614):1153-8. doi: 10.1098/rspb.2007.3768. Proc Biol Sci. 2007. PMID: 17301015 Free PMC article. - Do release-site biases reflect response to the Earth's magnetic field during position determination by homing pigeons?
Mora CV, Walker MM. Mora CV, et al. Proc Biol Sci. 2009 Sep 22;276(1671):3295-302. doi: 10.1098/rspb.2009.0872. Epub 2009 Jun 25. Proc Biol Sci. 2009. PMID: 19556255 Free PMC article. - Magnetic maps in pigeons.
Walcott C. Walcott C. EXS. 1991;60:38-51. doi: 10.1007/978-3-0348-7208-9_3. EXS. 1991. PMID: 1838522 Review. - Cues indicating location in pigeon navigation.
Beason RC, Wiltschko W. Beason RC, et al. J Comp Physiol A Neuroethol Sens Neural Behav Physiol. 2015 Oct;201(10):961-7. doi: 10.1007/s00359-015-1027-2. Epub 2015 Jul 7. J Comp Physiol A Neuroethol Sens Neural Behav Physiol. 2015. PMID: 26149606 Review.
Cited by
- Corneal sensitivity is required for orientation in free-flying migratory bats.
Lindecke O, Holland RA, Pētersons G, Voigt CC. Lindecke O, et al. Commun Biol. 2021 May 5;4(1):522. doi: 10.1038/s42003-021-02053-w. Commun Biol. 2021. PMID: 33953327 Free PMC article. - Bats respond to very weak magnetic fields.
Tian LX, Pan YX, Metzner W, Zhang JS, Zhang BF. Tian LX, et al. PLoS One. 2015 Apr 29;10(4):e0123205. doi: 10.1371/journal.pone.0123205. eCollection 2015. PLoS One. 2015. PMID: 25922944 Free PMC article. - Magnetoreception in birds.
Wiltschko R, Wiltschko W. Wiltschko R, et al. J R Soc Interface. 2019 Sep 27;16(158):20190295. doi: 10.1098/rsif.2019.0295. Epub 2019 Sep 4. J R Soc Interface. 2019. PMID: 31480921 Free PMC article. Review. - No evidence for the use of magnetic declination for migratory navigation in two songbird species.
Chernetsov N, Pakhomov A, Davydov A, Cellarius F, Mouritsen H. Chernetsov N, et al. PLoS One. 2020 Apr 24;15(4):e0232136. doi: 10.1371/journal.pone.0232136. eCollection 2020. PLoS One. 2020. PMID: 32330188 Free PMC article. - Trainable bioinspired magnetic sensitivity adaptation using ferromagnetic colloidal assemblies.
Liu X, Tan H, Stråka E, Hu X, Chen M, van Dijken S, Scacchi A, Sammalkorpi M, Ikkala O, Peng B. Liu X, et al. Cell Rep Phys Sci. 2024 Apr 17;5(4):101923. doi: 10.1016/j.xcrp.2024.101923. Cell Rep Phys Sci. 2024. PMID: 38680545 Free PMC article.
References
- Wiltschko R, Wiltschko W (1995) Magnetic orientation in animals. Berlin: Springer Verlag.
- Mouritsen H, Hore P (2012) The magnetic retina: light-dependent and trigeminal magnetoreception in migratory birds. Curr Opin Neurobiol 22: 343–352. - PubMed
- Mouritsen H (2012) Search for the compass needles. Nature 484: 320–321. - PubMed
- Boles LC, Lohmann KJ (2003) True navigation and magnetic maps in spiny lobsters. Nature 421: 60–63. - PubMed
- Fischer JH, Freake MJ, Borland SC, Phillips JB (2001) Evidence for the use of magnetic map information by an amphibian. Anim Behav 62: 1–10.
Publication types
MeSH terms
Grants and funding
This work was supported by a grant from The National Science Foundation [IOS-0922508 to VPB and CVM] as well as a Research Incentive Grant provided by the Faculty Research Committee at Bowling Green State University to VPB. The funders had no role in study design, data collection and analysis, decision to publish, or preparation of the manuscript.
LinkOut - more resources
Full Text Sources
Other Literature Sources


