RNA polymerase II C-terminal domain: Tethering transcription to transcript and template - PubMed (original) (raw)
Review
. 2013 Nov 13;113(11):8423-55.
doi: 10.1021/cr400158h. Epub 2013 Sep 16.
Affiliations
- PMID: 24040939
- PMCID: PMC3988834
- DOI: 10.1021/cr400158h
Review
RNA polymerase II C-terminal domain: Tethering transcription to transcript and template
Jeffry L Corden. Chem Rev. 2013.
No abstract available
Conflict of interest statement
The author declares no competing financial interest
Figures
Figure 1
Diagram showing the three regions of the CTD.
Figure 2
Idealized SDS PAGE separation of the Rpb1 subunit. Increasing phosphatase treatment increases the mobility of the IIo form while proteolysis increases the mobility of both forms. x refers to intermediate phosphorylation states while y refers to intermediates in CTD degradation.
Figure 3
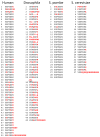
Sequences of CTDs from different organisms. The sequences are aligned to emphasize the heptad repeat. Residues in red deviate from the consensus.
Figure 4
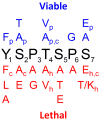
Phenotypes of CTD substitution mutants. Indicated phenotypes are due to substitution in each repeat. Red indicates lethal mutations while blue indicates viable mutations. Some mutations are listed as both viable and inviable depending one the organism as designated in subscripts (c = S. cerevisiae, p = S. pombe, and h = human).
Figure 5
Diagram showing the recognition of adjacent heptad repeats by the C. albicans capping enzyme CDS1 and CDS2 binding pockets. The dotted line indicates the potential position of additional repeats if the CDS1 and CDS2 binding pockets recognize heptads that are not adjacent but separated by one or more heptad repeat.
Figure 6
The CTD-interacting domain (CID). (a) Structures of the CID of Pcf11, Nrd1 and Scaf8 bound to CTD peptides. (b) Diagram showing the interaction of CID side chains with CTD residues. Black arrows indicate interactions with the ß-turn and preceding Tyr residue. Blue arrows indicate Scaf8 interactions with the downstream Tyr residue. Red arrows indicate interactions with phosphorylated Ser residues by Nrd1 and Scaf8. The position of these interactions is indicated by the same colors in part A. The wavey bond in the CTD peptide bound to Nrd1 indicates the cis conformation of this paptide bond. (c) Dotted lines indicate alternative binding modes for Pcf11 bound to a doubly phosphorylated CTD peptide. The solid line represents the interaction of SCAF8 with a doubly phosphorylated CTD repeat.
Similar articles
- TFIIH kinase places bivalent marks on the carboxy-terminal domain of RNA polymerase II.
Akhtar MS, Heidemann M, Tietjen JR, Zhang DW, Chapman RD, Eick D, Ansari AZ. Akhtar MS, et al. Mol Cell. 2009 May 15;34(3):387-93. doi: 10.1016/j.molcel.2009.04.016. Mol Cell. 2009. PMID: 19450536 Free PMC article. - Phosphorylation of the RNA polymerase II carboxy-terminal domain by the Bur1 cyclin-dependent kinase.
Murray S, Udupa R, Yao S, Hartzog G, Prelich G. Murray S, et al. Mol Cell Biol. 2001 Jul;21(13):4089-96. doi: 10.1128/MCB.21.13.4089-4096.2001. Mol Cell Biol. 2001. PMID: 11390638 Free PMC article. - The writers, readers, and functions of the RNA polymerase II C-terminal domain code.
Jeronimo C, Bataille AR, Robert F. Jeronimo C, et al. Chem Rev. 2013 Nov 13;113(11):8491-522. doi: 10.1021/cr4001397. Epub 2013 Jul 10. Chem Rev. 2013. PMID: 23837720 Review. No abstract available. - The RNA polymerase II carboxy-terminal domain (CTD) code.
Eick D, Geyer M. Eick D, et al. Chem Rev. 2013 Nov 13;113(11):8456-90. doi: 10.1021/cr400071f. Epub 2013 Aug 16. Chem Rev. 2013. PMID: 23952966 Review. No abstract available. - Mutual targeting of mediator and the TFIIH kinase Kin28.
Guidi BW, Bjornsdottir G, Hopkins DC, Lacomis L, Erdjument-Bromage H, Tempst P, Myers LC. Guidi BW, et al. J Biol Chem. 2004 Jul 9;279(28):29114-20. doi: 10.1074/jbc.M404426200. Epub 2004 May 4. J Biol Chem. 2004. PMID: 15126497
Cited by
- Thr4 phosphorylation on RNA Pol II occurs at early transcription regulating 3'-end processing.
Moreno RY, Panina SB, Irani S, Hardtke HA, Stephenson R, Floyd BM, Marcotte EM, Zhang Q, Zhang YJ. Moreno RY, et al. Sci Adv. 2024 Sep 6;10(36):eadq0350. doi: 10.1126/sciadv.adq0350. Epub 2024 Sep 6. Sci Adv. 2024. PMID: 39241064 Free PMC article. - Variation of C-terminal domain governs RNA polymerase II genomic locations and alternative splicing in eukaryotic transcription.
Zhang Q, Kim W, Panina S, Mayfield JE, Portz B, Zhang YJ. Zhang Q, et al. bioRxiv [Preprint]. 2024 Jan 2:2024.01.01.573828. doi: 10.1101/2024.01.01.573828. bioRxiv. 2024. PMID: 38260389 Free PMC article. Updated. Preprint. - Polyadenylation site selection: linking transcription and RNA processing via a conserved carboxy-terminal domain (CTD)-interacting protein.
Larochelle M, Hunyadkürti J, Bachand F. Larochelle M, et al. Curr Genet. 2017 May;63(2):195-199. doi: 10.1007/s00294-016-0645-8. Epub 2016 Aug 31. Curr Genet. 2017. PMID: 27582274 Review. - Evolution of lysine acetylation in the RNA polymerase II C-terminal domain.
Simonti CN, Pollard KS, Schröder S, He D, Bruneau BG, Ott M, Capra JA. Simonti CN, et al. BMC Evol Biol. 2015 Mar 10;15:35. doi: 10.1186/s12862-015-0327-z. BMC Evol Biol. 2015. PMID: 25887984 Free PMC article. - Disordered C-terminal domain drives spatiotemporal confinement of RNAPII to enhance search for chromatin targets.
Ling YH, Ye Z, Liang C, Yu C, Park G, Corden JL, Wu C. Ling YH, et al. bioRxiv [Preprint]. 2023 Nov 30:2023.07.31.551302. doi: 10.1101/2023.07.31.551302. bioRxiv. 2023. PMID: 37577667 Free PMC article. Updated. Preprint.
References
- Chapman RD, Heidemann M, Hintermair C, Eick D. Trends Genet. 2008;24:289. - PubMed
- Cramer P, Bushnell DA, Kornberg RD. Science. 2001;292:1863. - PubMed
- Roeder RG. In: RNA Polymerase. Losick R, Chamberlin M, editors. Cold Spring Harbor Laboratory; Cold Spring Harbor, New York: 1976.
- Dahmus ME. J Biol Chem. 1983;258:3956. - PubMed
- Greenleaf AL, Haars R, Bautz EK. FEBS Lett. 1976;71:205. - PubMed
Publication types
MeSH terms
Substances
LinkOut - more resources
Full Text Sources
Other Literature Sources


