A novel role for keratin 17 in coordinating oncogenic transformation and cellular adhesion in Ewing sarcoma - PubMed (original) (raw)
A novel role for keratin 17 in coordinating oncogenic transformation and cellular adhesion in Ewing sarcoma
Savita Sankar et al. Mol Cell Biol. 2013 Nov.
Abstract
Oncogenic transformation in Ewing sarcoma is caused by EWS/FLI, an aberrant transcription factor fusion oncogene. Glioma-associated oncogene homolog 1 (GLI1) is a critical target gene activated by EWS/FLI, but the mechanism by which GLI1 contributes to the transformed phenotype of Ewing sarcoma was unknown. In this work, we identify keratin 17 (KRT17) as a direct downstream target gene upregulated by GLI1. We demonstrate that KRT17 regulates cellular adhesion by activating AKT/PKB (protein kinase B) signaling. In addition, KRT17 is necessary for oncogenic transformation in Ewing sarcoma and accounts for much of the GLI1-mediated transformation function but via a mechanism independent of AKT signaling. Taken together, our data reveal previously unknown molecular functions for a cytoplasmic intermediate filament protein, KRT17, in coordinating EWS/FLI- and GLI1-mediated oncogenic transformation and cellular adhesion in Ewing sarcoma.
Figures
Fig 1
GLI1 is upregulated by EWS/FLI and is necessary for oncogenic transformation in Ewing sarcoma cells. (A) Western blot analysis to demonstrate EWS/FLI-mediated activation of GLI1. GLI1 and EWS/FLI levels were assessed in A673 cells infected with a control shRNA (Luc) or an shRNA targeting EWS/FLI, followed by rescue with an empty vector or an RNAi-resistant EWS/FLI cDNA using anti-GLI1 and anti-FLI antibodies. Tubulin was used as a loading control. The asterisk indicates the 3×FLAG-tagged EWS/FLI cDNA that runs slightly higher than endogenous EWS/FLI. (B) Western blot analysis to demonstrate expression of the RNAi-resistant 3×FLAG-tagged EWS/FLI cDNA or 3×FLAG-tagged GLI1 cDNA constructs using an anti-FLAG antibody in A673 cells expressing a control shRNA (Luc) or an EWS/FLI shRNA. Tubulin was used as the loading control. (C) Quantification of colonies formed by A673 cells described above for panel B. Error bars indicate standard deviations of duplicate assays. P values were determined by using Student's t test, comparing all conditions to the control knockdown/empty vector condition (∗∗∗, P ≤ 0.001). (D) Western blot analysis of GLI1 levels in A673 cells infected with a control shRNA (Luc) or an shRNA targeting GLI1, followed by rescue with an empty vector or an RNAi-resistant GLI1 cDNA. Tubulin was used as a loading control. The asterisk indicates the 3×FLAG-tagged GLI1 cDNA that runs slightly higher than endogenous GLI1. (E) Growth assays (3T5) for the A673 cells described above for panel D. Student's t test showed no significant difference in growth curves. (F) Quantification of colonies formed in soft agar by A673 cells expressing a control shRNA (Luc) or a GLI1 shRNA, reexpressing an empty vector or RNAi-resistant GLI1 or NKX2.2 cDNA constructs. Error bars indicate standard deviations of duplicate assays. P values were determined by using Student's t test, comparing all conditions to the control knockdown/empty vector condition (∗∗, P ≤ 0.01).
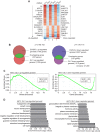
Fig 2
GLI1 regulates a significant portion of the EWS/FLI transcription profile in Ewing sarcoma cells. (A) Heat map representation of the rank-ordered expression profiling data from GLI1 RNA-seq analysis. Genes were ranked by mean deviations of the log-transformed fragments per kilobase per million mapped reads. The columns for each shRNA represent three independent biological replicates. Each row represents a different gene. The top 15 upregulated (left) and downregulated (right) genes from the GLI1 RNA-seq analysis are shown. (B) Venn diagram representations of the overlap between the EWS/FLI and the GLI1 transcription profiles, both generated by RNA-seq analysis of A673 cells. The chi-square-determined P values are indicated. (C) Gene set enrichment analysis (GSEA) using the EWS/FLI-regulated genes in A673 cells (RNA-seq) as the rank-ordered data set and the 86 Gli1-upregulated and 55 GLI1-downregulated gene sets (RNA-seq). The normalized enrichment scores (NES) and P values are shown. (D) Top 10 categories identified by DAVID functional analysis of the GLI1-upregulated and -downregulated gene sets. The log-transformed enrichment scores for each category are indicated on the x axis.
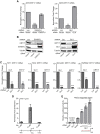
Fig 3
KRT17 is regulated by GLI1 in multiple Ewing sarcoma cell lines. (A) Validation of KRT17 as an EWS/FLI and GLI1 target gene. Shown are data for qRT-PCR analysis of KRT17 in A673 cells infected with a control shRNA (Luc), an EWS/FLI shRNA, or a GLI1 shRNA, followed by rescue with an empty vector, an RNAi-resistant EWS/FLI cDNA, or a GLI1 cDNA construct. Error bars indicate standard deviations. P values were determined by using Student's t test, comparing all conditions to the control knockdown/empty vector condition (∗∗, P ≤ 0.01; ∗∗∗, P ≤ 0.001). (B) Western blot analysis of cells described above for panel A, using KRT17, EWS/FLI, and GLI1 antibodies. Tubulin was used as the loading control. The red asterisks indicate the 3×FLAG-tagged EWS/FLI and GLI1 cDNAs. (C) qRT-PCR validation of KRT17 as a GLI1 target gene in multiple patient-derived Ewing sarcoma cell lines (TC71, TC32, SK-N-MC, and EWS502). Cells were infected with a control shRNA (Luc) or a GLI1 shRNA. GLI1 and KRT17 mRNA levels were analyzed. Error bars indicate standard deviations. P values were determined by using Student's t test, comparing all conditions to the control knockdown (Luc-shRNA) (∗∗, P ≤ 0.01; ∗∗∗, P ≤ 0.001). (D) ChIP of 3×FLAG GLI1 at the KRT17 promoter in A673 cells expressing a GLI1-RNAi and reexpressing an empty vector or 3×FLAG GLI1 cDNA. An anti-FLAG antibody was used to chromatin immunoprecipitate 3×FLAG GLI1. The transcriptional start site (TSS) and a region ∼150 bp upstream of the TSS with significant GLI1 binding are indicated. The level of enrichment for 3×FLAG GLI1 at the KRT17 promoter in cells reexpressing the 3×FLAG GLI1 cDNA is plotted as normalized fold enrichment compared to the enrichment in the empty-vector-reexpressing cells, with the fold enrichment for each sample being compared to the average enrichment at two negative-control genes, ALB and a gene desert region in the genome. Enrichment of 3×FLAG GLI1 at regions 5 kb upstream and 5 kb downstream of the FIMO-identified binding sites were used as negative controls to further demonstrate binding specificity for GLI1 at the KRT17 promoter. The error bars indicate standard deviations of a representative experiment. (E) Luciferase reporter assay with HEK293 EBNA cells cotransfected with a 1-kb KRT17 promoter region upstream of luciferase or a control vector (that does not contain the KRT17 promoter) and an empty vector or increasing concentrations of the GLI1 cDNA. Relative luciferase activity is the ratio of firefly luciferase activity to Renilla luciferase activity (to control for transfection efficiency). The red asterisks indicate potential GLI1 binding sites in the KRT17 promoter. The error bars indicate standard deviations. P values were determined by using Student's t test, comparing all GLI1 cDNA-transfected conditions to the vector-transfected conditions (∗∗, P ≤ 0.01).
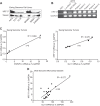
Fig 4
KRT17 is expressed in Ewing sarcoma cell lines and primary tumors. (A) Western blot analysis of KRT17 expression in multiple patient-derived Ewing sarcoma cell lines (A673, TC71, TC32, SKNMC, SKES1, and EWS502). Tubulin was used as the loading control. (B) Maximum threshold cycle RT-PCR analysis of KRT17 transcript levels in five independent Ewing sarcoma patient tumor samples compared to KRT17 transcript levels in A673 cells infected with a control shRNA (Luc) or a KRT17 shRNA as well as a water negative control. (C) Linear regression analysis to determine the correlation between EWS/FLI and GLI1 expression and between GLI1 and KRT17 expression in the patient tumor samples described above for panel B. The expression levels were determined by qRT-PCR and plotted as a percentage of the expression level of the housekeeping gene (GAPDH). The _R_2 value is indicated. (D) Linear regression analysis to determine the correlation between GLI1 and KRT17 expression in a publically available microarray data set (Ohali sarcoma data set) consisting of 20 Ewing sarcoma tumor samples (42). The mRNA expression values for GLI1 and KRT17 in each tumor sample were obtained through Oncomine (
) and plotted as a percentage of the value for the housekeeping gene (GAPDH). The _R_2 value is indicated.
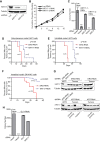
Fig 5
KRT17 is necessary for GLI1-mediated oncogenesis in Ewing sarcoma. (A) Western blot analysis of KRT17 in A673 cells infected with a control shRNA (Luc) or two different shRNA constructs targeting KRT17. Tubulin was used as the loading control. (B) Growth assays (3T5) for the A673 cells described above for panel A. Student's t test showed no significant difference in growth curves. (C) Quantification of colonies formed in methylcellulose by A673 cells expressing a control shRNA (Luc) or two different KRT17 shRNAs, reexpressing an empty vector or an RNAi-resistant KRT17 cDNA construct. Error bars indicate standard deviations of duplicate assays. P values were determined by using Student's t test, comparing all conditions to the control knockdown/empty vector condition (∗∗, P ≤ 0.01). (D to F) Survival curves for immunodeficient mice subjected to subcutaneous or intratibial injections with A673 cells or SK-N-MC cells expressing a control shRNA (ERG) or a KRT17 shRNA. Five mice and 12 mice were used per condition for the A673 cells and the SK-N-MC cells, respectively. For the subcutaneous model, both flanks of each mouse were injected subcutaneously. Under the control conditions, one mouse died due to the anesthesia and was censored from the analysis. Therefore, 8 and 10 tumors were measured for the control knockdown and KRT17 knockdown groups, respectively. For the intratibial model, the right tibia of each mouse was injected, and therefore, 5 tumors for the A673 group and 12 tumors for the SK-N-MC group were measured for both the control (ERG) knockdown and the KRT17 knockdown groups. The mice in each group in the subcutaneous model were sacrificed once their tumors reached a size limit of 2 cm3. The mice in each group in the intratibial model for both A673 and SK-N-MC cells were sacrificed once their tumors reached a size limit of 1.5 cm3. Percent survival was plotted for both models as Kaplan-Meier survival curves by using GraphPad Prism. The P values determined by log-rank test (Mantel-Cox test) using GraphPad Prism are indicated. (G) Western blot analysis of control (ERG) shRNA- or KRT17 shRNA-expressing tumors from the subcutaneous injection model described above for panel D. KRT17 levels in the tumors were compared to levels in the parental A673 cells expressing either the control shRNA or KRT17 shRNA, used to inject mice. Tubulin was used as the loading control. (H) Quantification of colonies formed in methylcellulose by A673 cells expressing a control shRNA (Luc) or a GLI1 shRNA and reexpressing the empty vector, 3×FLAG-tagged GLI1, or 3×FLAG-tagged KRT17 cDNA constructs. Error bars indicate standard deviations of duplicate assays. The P value was determined by using Student's t test, comparing the GLI1 knockdown/empty vector conditions to the control knockdown/empty vector conditions (∗∗∗, P ≤ 0.001).
Fig 6
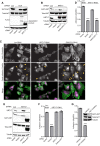
KRT17 is necessary and sufficient for AKT phosphorylation-mediated cellular adhesion in Ewing sarcoma cells. (A) Western blot analysis of A673 cells infected with a control shRNA (Luc) or the GLI1 shRNA and reexpressing the empty vector, GLI1, or KRT17 cDNA constructs. The protein lysates from these cells were probed with phosphorylated AKT (S473), total AKT, and FLAG antibodies. Tubulin was used as a loading control. (B) Western blot analysis of A673 cells infected with a control shRNA (Luc) or a KRT17 shRNA and reexpressing an empty vector, the KRT17 wild-type, or an S44A mutant KRT17 cDNA construct. The protein lysates from these cells were probed with phosphorylated AKT (S473), total AKT, and KRT17 antibodies. The asterisks indicate 3×FLAG-tagged KRT17 and 3×FLAG-tagged S44A KRT17 cDNA constructs, which run slightly higher than endogenous KRT17. Tubulin was used as a loading control. (C) Immunofluorescence images of A673 cells infected with control shRNA (Luc), KRT17 shRNA, or EWS/FLI shRNA stained for focal adhesions (paxillin antibody) and for actin filaments (phalloidin). Arrowheads indicate paxillin-rich focal adhesions. (D) Adhesion assay with A673 cells infected with a control shRNA (Luc) or a KRT17 shRNA and reexpressing the empty vector, KRT17 wild-type, or S44A mutant KRT17 cDNA constructs. Error bars indicate standard deviations. P values were determined by using Student's t test, comparing all conditions to the control knockdown/empty vector conditions (∗∗∗, P ≤ 0.001). (E) Western blot analysis of A673 cells infected with a control shRNA (Luc) or a KRT17 shRNA and reexpressing an empty vector, KRT17 cDNA, or a constitutively active (myristoylated) form of AKT. The protein lysates from these cells were probed with KRT17, phosphorylated AKT (S473), and total AKT antibodies. Tubulin was used as a loading control. (F) Adhesion assay with the A673 cells described above for panel E. Error bars indicate standard deviations. The P value was determined by using Student's t test, comparing the KRT17 knockdown/empty vector conditions to the control knockdown/empty vector conditions (∗∗∗, P ≤ 0.001). (G) Adhesion assay with A673 cells treated with the selective AKT inhibitor or the vehicle control for 24 h. Error bars indicate standard deviations. The P value was determined by using Student's t test, comparing the inhibitor-treated conditions to the vehicle-treated conditions (∗∗∗, P ≤ 0.001).
Fig 7
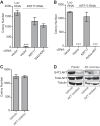
KRT17-mediated oncogenic transformation is independent of AKT signaling. (A) Quantification of colonies formed in methylcellulose by A673 cells infected with a control shRNA (Luc) or a KRT17 shRNA and reexpressing the empty vector, the KRT17 wild-type, or the S44A mutant KRT17 cDNA construct. Error bars indicate standard deviations of duplicate assays. The P value was determined by using Student's t test, comparing the conditions of a KRT17 knockdown rescued with an empty vector to those of the control knockdown rescued with an empty vector (∗∗∗, P ≤ 0.001). (B) Quantification of colonies formed in methylcellulose by A673 cells infected with a control shRNA (Luc) or a KRT17 shRNA and reexpressing an empty vector, KRT17 cDNA, or a constitutively active (myristoylated) form of AKT. Error bars indicate standard deviations of duplicate assays. P values were determined by using Student's t test, comparing all conditions to the control knockdown/empty vector conditions (∗∗∗, P ≤ 0.001). (C) Quantification of colonies formed in methylcellulose by A673 cells treated with a selective AKT inhibitor or a vehicle control for 24 h. Error bars indicate standard deviations of duplicate assays. (D) Western blot analysis of the A673 cells described above for panel C. Protein lysates from treated cells and from 3D colonies at the end of the anchorage-independent colony-forming assay were probed with phosphorylated AKT (S473) and total AKT antibodies. Tubulin was used as the loading control. The total amount of protein obtained from the 3D colonies was much smaller than that obtained from cells grown and treated on plastic.
Similar articles
- Mechanism and relevance of EWS/FLI-mediated transcriptional repression in Ewing sarcoma.
Sankar S, Bell R, Stephens B, Zhuo R, Sharma S, Bearss DJ, Lessnick SL. Sankar S, et al. Oncogene. 2013 Oct 17;32(42):5089-100. doi: 10.1038/onc.2012.525. Epub 2012 Nov 26. Oncogene. 2013. PMID: 23178492 Free PMC article. - FOXM1 is an oncogenic mediator in Ewing Sarcoma.
Christensen L, Joo J, Lee S, Wai D, Triche TJ, May WA. Christensen L, et al. PLoS One. 2013;8(1):e54556. doi: 10.1371/journal.pone.0054556. Epub 2013 Jan 24. PLoS One. 2013. PMID: 23365673 Free PMC article. - The FLI portion of EWS/FLI contributes a transcriptional regulatory function that is distinct and separable from its DNA-binding function in Ewing sarcoma.
Boone MA, Taslim C, Crow JC, Selich-Anderson J, Byrum AK, Showpnil IA, Sunkel BD, Wang M, Stanton BZ, Theisen ER, Lessnick SL. Boone MA, et al. Oncogene. 2021 Jul;40(29):4759-4769. doi: 10.1038/s41388-021-01876-5. Epub 2021 Jun 18. Oncogene. 2021. PMID: 34145397 Free PMC article. - Molecular pathogenesis of Ewing sarcoma: new therapeutic and transcriptional targets.
Lessnick SL, Ladanyi M. Lessnick SL, et al. Annu Rev Pathol. 2012;7:145-59. doi: 10.1146/annurev-pathol-011110-130237. Epub 2011 Sep 19. Annu Rev Pathol. 2012. PMID: 21942527 Free PMC article. Review. - Therapeutic opportunities in Ewing sarcoma: EWS-FLI inhibition via LSD1 targeting.
Theisen ER, Pishas KI, Saund RS, Lessnick SL. Theisen ER, et al. Oncotarget. 2016 Apr 5;7(14):17616-30. doi: 10.18632/oncotarget.7124. Oncotarget. 2016. PMID: 26848860 Free PMC article. Review.
Cited by
- Multiple roles for keratin intermediate filaments in the regulation of epithelial barrier function and apico-basal polarity.
Salas PJ, Forteza R, Mashukova A. Salas PJ, et al. Tissue Barriers. 2016 May 2;4(3):e1178368. doi: 10.1080/21688370.2016.1178368. eCollection 2016 Jul-Sep. Tissue Barriers. 2016. PMID: 27583190 Free PMC article. Review. - Transcriptomic analysis functionally maps the intrinsically disordered domain of EWS/FLI and reveals novel transcriptional dependencies for oncogenesis.
Theisen ER, Miller KR, Showpnil IA, Taslim C, Pishas KI, Lessnick SL. Theisen ER, et al. Genes Cancer. 2019 Feb;10(1-2):21-38. doi: 10.18632/genesandcancer.188. Genes Cancer. 2019. PMID: 30899417 Free PMC article. - Cytoskeletal Remodeling in Cancer.
Aseervatham J. Aseervatham J. Biology (Basel). 2020 Nov 7;9(11):385. doi: 10.3390/biology9110385. Biology (Basel). 2020. PMID: 33171868 Free PMC article. Review. - The Role of Keratin17 in Human Tumours.
Zhang H, Zhang Y, Xia T, Lu L, Luo M, Chen Y, Liu Y, Li Y. Zhang H, et al. Front Cell Dev Biol. 2022 Feb 24;10:818416. doi: 10.3389/fcell.2022.818416. eCollection 2022. Front Cell Dev Biol. 2022. PMID: 35281081 Free PMC article. Review. - Intermediate Filaments as Effectors of Cancer Development and Metastasis: A Focus on Keratins, Vimentin, and Nestin.
Sharma P, Alsharif S, Fallatah A, Chung BM. Sharma P, et al. Cells. 2019 May 23;8(5):497. doi: 10.3390/cells8050497. Cells. 2019. PMID: 31126068 Free PMC article. Review.
References
- Arndt CA, Crist WM. 1999. Common musculoskeletal tumors of childhood and adolescence. N. Engl. J. Med. 341:342–352 - PubMed
- Delattre O, Zucman J, Plougastel B, Desmaze C, Melot T, Peter M, Kovar H, Joubert I, de Jong P, Rouleau G, Aurias A, Thomas G. 1992. Gene fusion with an ETS DNA-binding domain caused by chromosome translocation in human tumours. Nature 359:162–165 - PubMed
- Smith R, Owen LA, Trem DJ, Wong JS, Whangbo JS, Golub TR, Lessnick SL. 2006. Expression profiling of EWS/FLI identifies NKX2.2 as a critical target gene in Ewing's sarcoma. Cancer Cell 9:405–416 - PubMed
- Kinsey M, Smith R, Lessnick SL. 2006. NR0B1 is required for the oncogenic phenotype mediated by EWS/FLI in Ewing's sarcoma. Mol. Cancer Res. 4:851–859 - PubMed
Publication types
MeSH terms
Substances
Grants and funding
- P30 CA042014/CA/NCI NIH HHS/United States
- R01 CA140394/CA/NCI NIH HHS/United States
- R01 GM050877/GM/NIGMS NIH HHS/United States
- HHMI/Howard Hughes Medical Institute/United States
LinkOut - more resources
Full Text Sources
Other Literature Sources
Medical
Miscellaneous

